How Man United’s Valuation Stacks Up as Rival Clubs Strike Billion Dollar Deals
Manchester United Plc Class A MANU | 17.22 17.22 | +1.35% 0.00% Post |
Thinking about what to do with Manchester United stock? You are definitely not alone. After a modest pop of 3.3% over the past week, some traders see signs of life, while others point to a more sobering 7.8% drop over the last month. Year-to-date, Man United shares are down 3.4%, with a gentle 1.0% uptick over the past year, and a 16.0% gain if you have been holding since three years ago. It has been a bit of a mixed bag. This is certainly nothing like the surging sport valuations that have been grabbing headlines lately, such as the blockbuster deals for major U.S. teams, but also not the worst place to have put your money in recent times.
What is interesting is that Manchester United moves in a world where even mere whispers of ownership changes at rival clubs or jaw-dropping sponsorship deals can catch investor attention. While most of the recent market buzz has been focused on other major franchises switching hands, and Manchester City's record kit agreement, there is a sense that sports assets as a whole remain under the microscope. Yet for all this industry excitement, Manchester United's current valuation score sits at 0 out of 6, meaning the usual valuation metrics do not show any areas where the stock trades at a clear discount right now.
So how does that square with the price swings we have seen? Are investors missing something? Let us take a closer look at those valuation checks, and explore whether there is a smarter way to judge Manchester United's true worth as an investment.
Manchester United scores just 0/6 on our valuation checks. See what other red flags we found in the full valuation breakdown.Approach 1: Manchester United Discounted Cash Flow (DCF) Analysis
The Discounted Cash Flow (DCF) model estimates a company's intrinsic value by projecting how much cash the business can generate in the future and then discounting those estimates back to today's pounds. In Manchester United’s case, this approach uses current and future free cash flows, all denominated in £, to determine a fair share price.
Right now, the club’s last twelve months of free cash flow sits at a negative £84.4 million. Analysts provide five years of formal estimates, and then further forecasts up to 2035 are extrapolated based on trends by Simply Wall St. For instance, cash flow is expected to swing positive, reaching £98 million in 2027. The DCF analysis estimates that by 2035, free cash flow could reach £157.4 million. All those future flows are discounted back to the present using a reasonable rate to come up with an intrinsic value.
Based on this particular model, the estimated fair value per share comes out to £11.51. In comparison to the current market price, the model suggests the stock is trading at a 42.6% premium. This makes Manchester United shares appear considerably overvalued by this measure.
Result: OVERVALUED
Head to the Valuation section of our Company Report for more details on how we arrive at this Fair Value for Manchester United.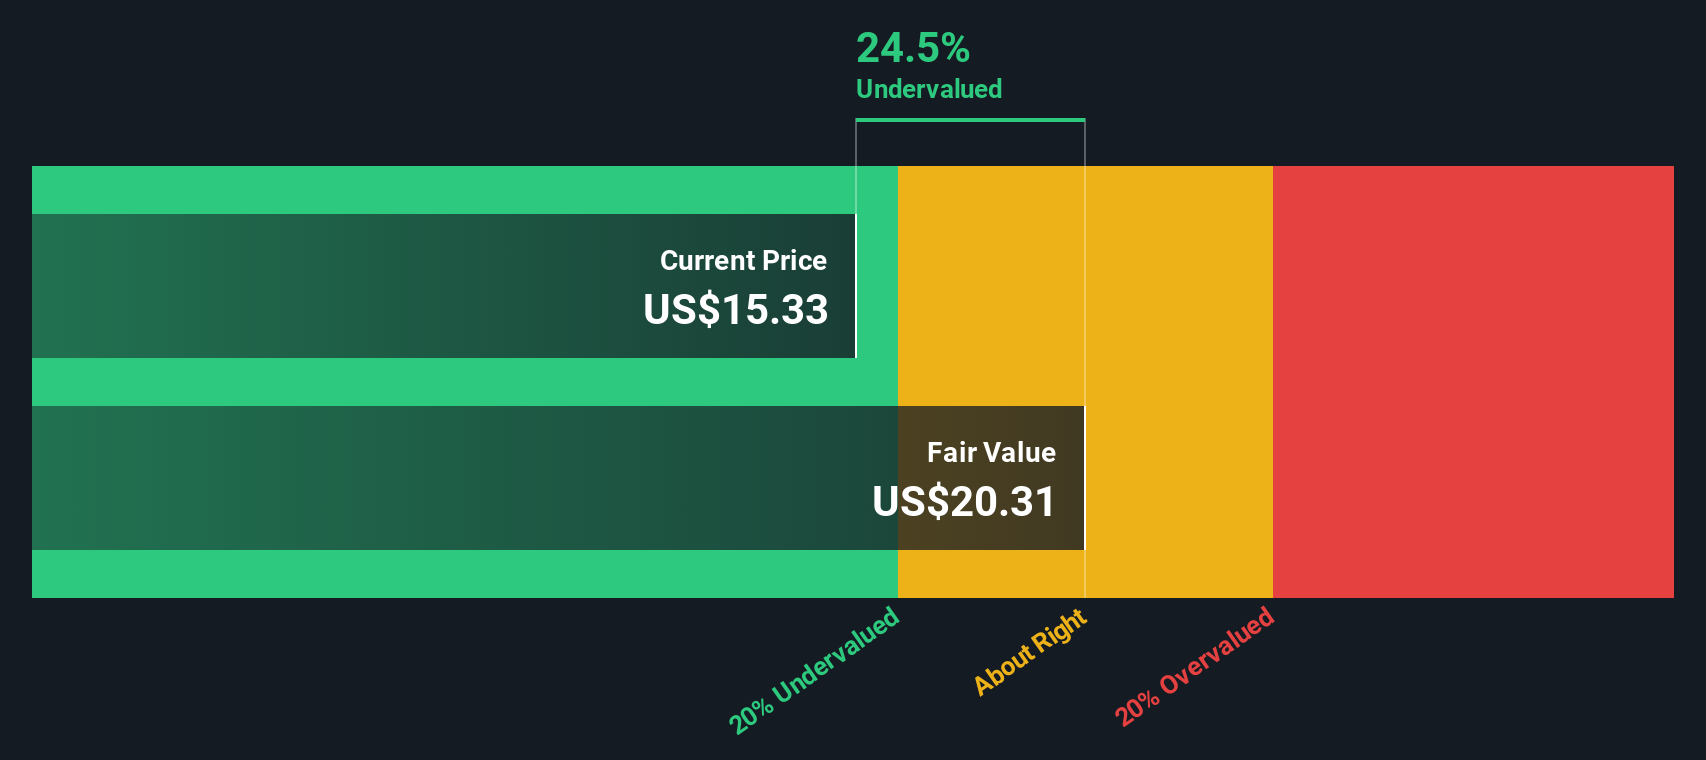
Approach 2: Manchester United Price vs Sales
For companies like Manchester United, where consistent profitability can be a challenge, the Price-to-Sales (P/S) ratio is often the preferred valuation metric. This is because P/S is less affected by short-term fluctuations in earnings and provides a clearer picture of what investors are paying for every pound of the company's revenue. This is especially helpful in industries where profits can be lumpy or reinvested heavily for growth.
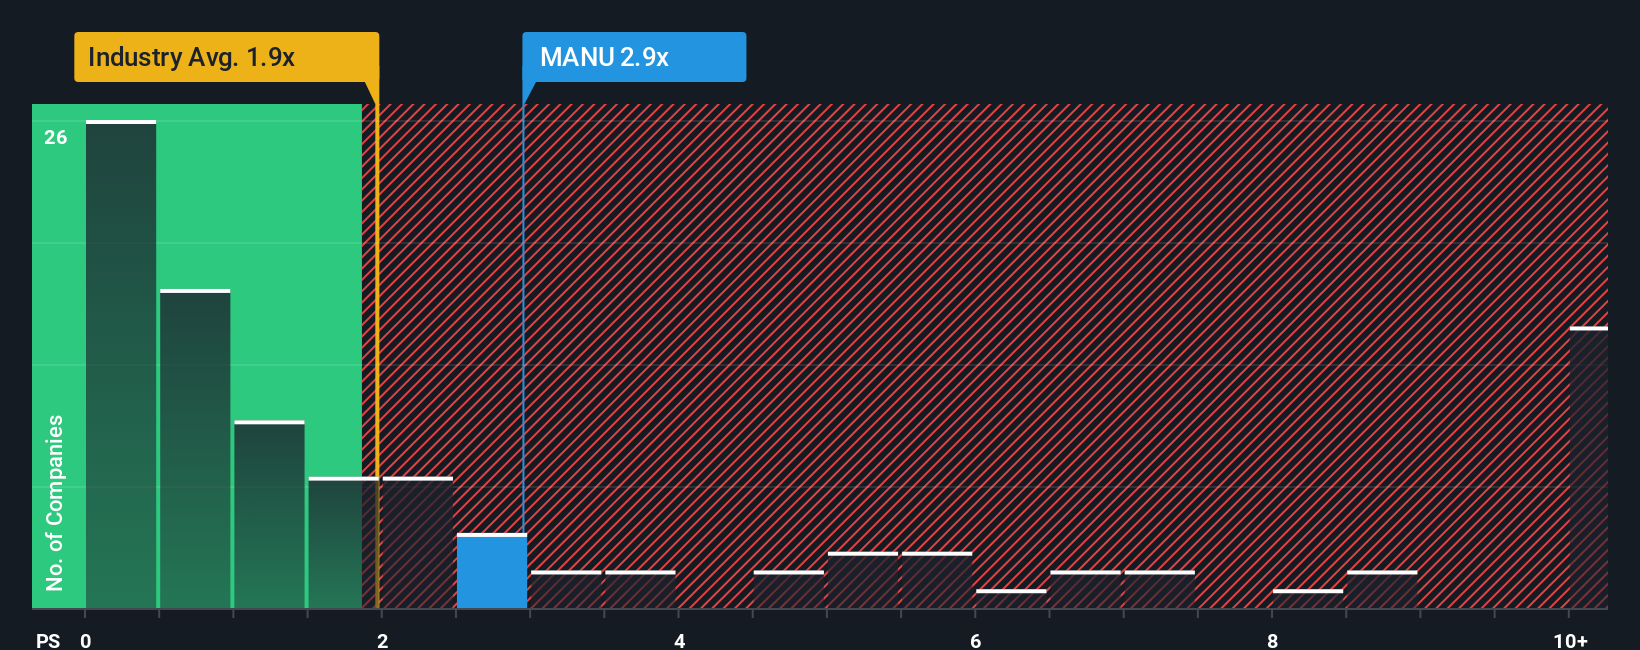
A company’s P/S ratio tells us how much the market values its sales compared to those of its peers. Investors typically expect higher P/S ratios for businesses with strong growth prospects and lower risk, while companies facing intense competition or uncertain futures justify lower ratios. For Manchester United, the current P/S ratio is 3.20x, compared to a peer average of 1.48x and an entertainment industry average of 1.91x. This suggests the stock trades at a premium to both its immediate peers and the broader sector.
To add more context, Simply Wall St’s Fair Ratio of 2.05x goes a step further than simple peer or industry comparisons. This Fair Ratio incorporates not just sector norms, but also Manchester United’s growth expectations, profit margins, scale, and overall risk profile. By considering these additional factors, the Fair Ratio provides a more tailored benchmark for what a fair multiple should look like for this specific business at this stage of its lifecycle.
Since Manchester United’s actual P/S multiple is notably higher than the Fair Ratio, the shares appear to be trading above what fundamentals would support.
Result: OVERVALUED
Upgrade Your Decision Making: Choose your Manchester United Narrative
Earlier we mentioned that there is an even better way to understand valuation, so let us introduce you to Narratives. A Narrative is simply your own story about a company that connects its business outlook and milestones to your assumptions for future revenue, profits, and a fair share price. Instead of just looking at raw numbers, Narratives allow you to tie together your perspective on Manchester United’s growth potential and risks, and how those might translate into its true worth as an investment.
This approach makes investing more personal and intuitive by letting you set your expectations, link them to financial forecasts, and see a fair value that reflects your thinking. Narratives are easy to use and available right on Simply Wall St’s Community page, where millions of investors are already sharing their views. As news and earnings updates arrive, Narratives adjust automatically, keeping your viewpoint current and relevant.
They also help you decide when to buy or sell by showing whether your fair value is above or below the current market price. For example, one investor might see broadcast rights soaring and set their fair value for Manchester United much higher than today’s price, while another could take a more cautious view and see less upside.
Do you think there's more to the story for Manchester United? Create your own Narrative to let the Community know!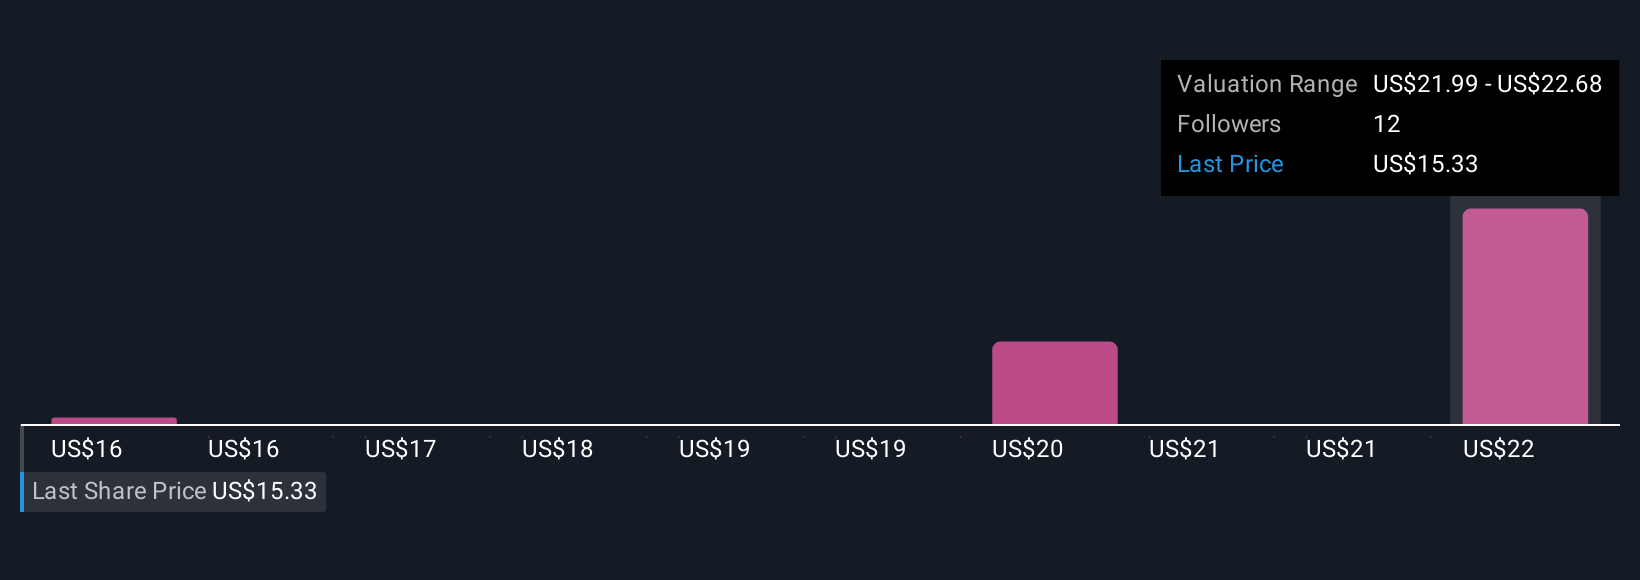
This article by Simply Wall St is general in nature. We provide commentary based on historical data and analyst forecasts only using an unbiased methodology and our articles are not intended to be financial advice. It does not constitute a recommendation to buy or sell any stock, and does not take account of your objectives, or your financial situation. We aim to bring you long-term focused analysis driven by fundamental data. Note that our analysis may not factor in the latest price-sensitive company announcements or qualitative material. Simply Wall St has no position in any stocks mentioned.