

How Slowing Growth and Margin Pressure Will Impact lululemon athletica (LULU) Investors
lululemon athletica inc. LULU | 0.00 |
- In recent days, Lululemon athletica has been flagged by analysts for slowing growth, declining comparable sales, margin pressure from tariffs and fixed costs, and sharply reduced earnings estimates that led to a Strong Sell rating and lower full‑year profit guidance.
- Despite these headwinds, the company still operates with a relatively high gross margin of 57.5% and an operating margin of 20.8%, trading at a forward P/E of 10.2x that has drawn attention given its compressed earnings outlook and brand challenges.
- We’ll now examine how falling earnings estimates and softer comparable sales readings may reshape Lululemon’s previously outlined investment narrative and expectations.
Rare earth metals are an input to most high-tech devices, military and defence systems and electric vehicles. The global race is on to secure supply of these critical minerals. Beat the pack to uncover the 29 best rare earth metal stocks of the very few that mine this essential strategic resource.
lululemon athletica Investment Narrative Recap
To own Lululemon today, you need to believe its premium brand, international growth and digital capabilities can offset slowing U.S. demand, tariff pressure and rising competition. The latest cut to earnings estimates and Strong Sell rating directly challenge the near term catalyst of a successful product reset, while amplifying the biggest risk right now: that weaker comparable sales and margin compression persist longer than expected.
One recent development that stands out in this context is Lululemon’s removal from several Russell indexes, which may reduce passive ownership and add volatility around a time of falling estimates. Combined with management’s lower full year profit guidance, this index exit puts even more focus on whether the company can stabilize comps and margins before further outflows or sentiment shifts compound the current pressure.
Yet behind the strong brand and healthy margins, investors should also be aware of growing tariff related cost pressure and the risk that...
lululemon athletica's narrative projects $12.3 billion revenue and $1.6 billion earnings by 2029. This requires 3.2% yearly revenue growth and about a $0.1 billion earnings increase from $1.5 billion today.
Uncover how lululemon athletica's forecasts yield a $132.16 fair value, a 16% upside to its current price.
Exploring Other Perspectives
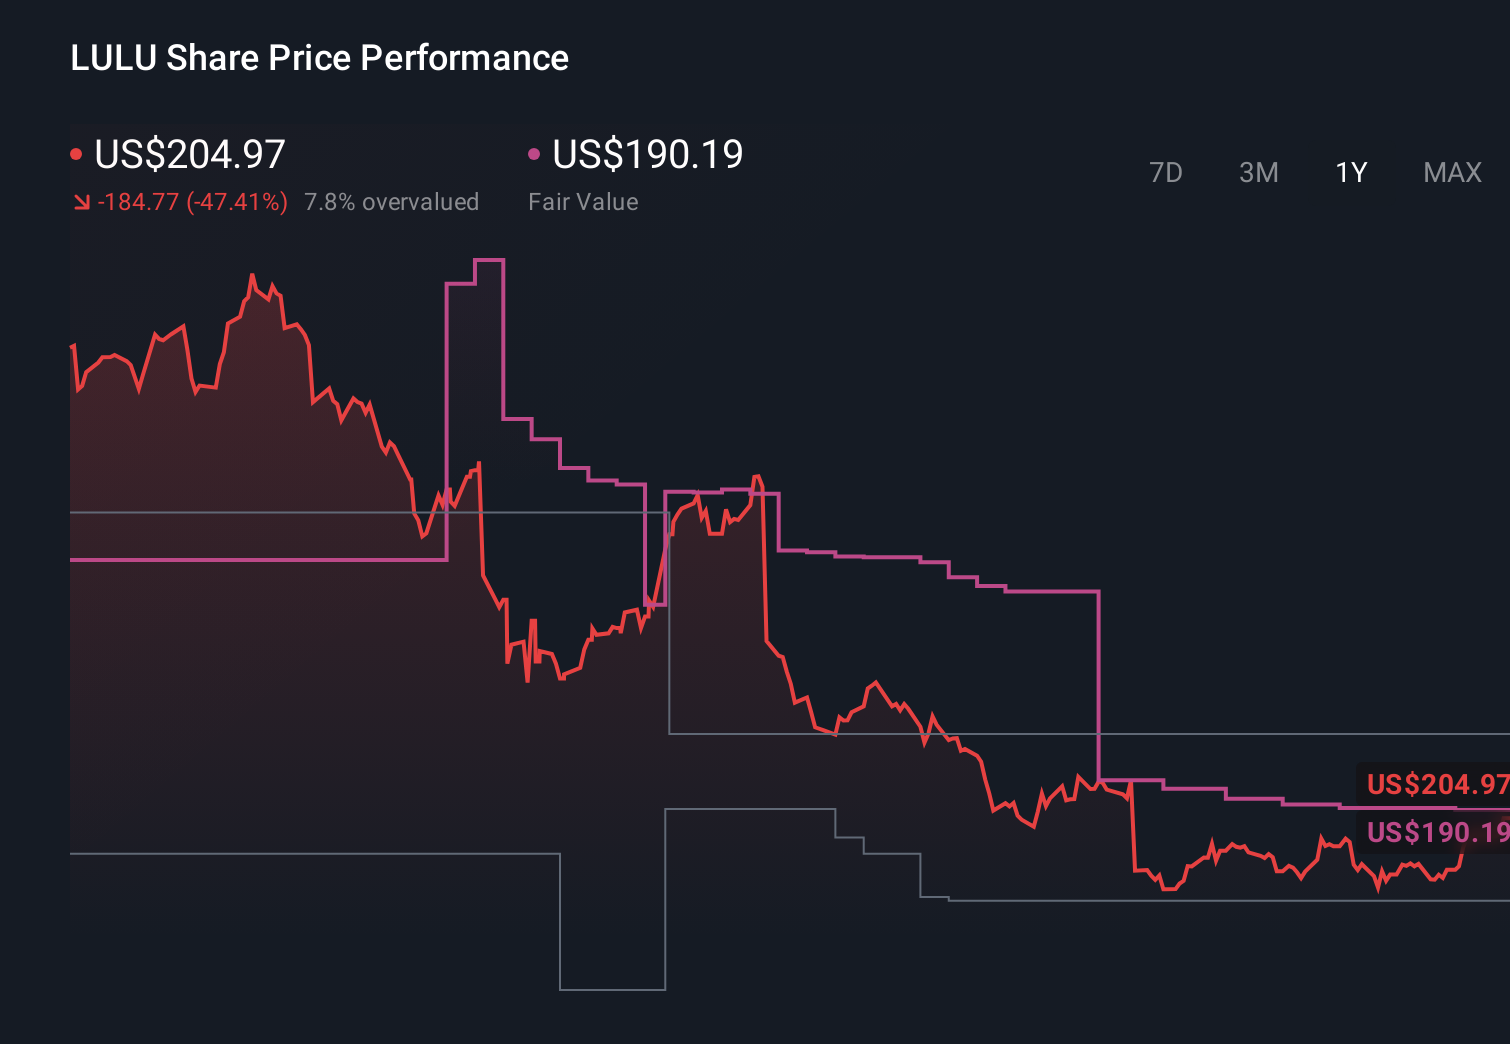
While consensus is recalibrating after weaker comps, the most optimistic analysts were once modeling revenue of about US$12.7 billion and earnings near US$1.7 billion, so if you compare that to today’s tariff and demand concerns you can see just how wide the gap in views can be and why it is worth exploring several different scenarios before you decide what you think.
Explore 37 other fair value estimates on lululemon athletica - why the stock might be worth 35% less than the current price!
Reach Your Own Conclusion
Don't just follow the ticker - dig into the data and build a conviction that's truly your own.
- A great starting point for your lululemon athletica research is our analysis highlighting 2 key rewards that could impact your investment decision.
- Our free lululemon athletica research report provides a comprehensive fundamental analysis summarized in a single visual - the Snowflake - making it easy to evaluate lululemon athletica's overall financial health at a glance.
Want Some Alternatives?
Don't miss your shot at the next 10-bagger. Our latest stock picks just dropped:
- Capitalize on the AI infrastructure supercycle with our selection of the 55 best 'picks and shovels' of the AI gold rush converting record-breaking demand into massive cash flow.
- Uncover the next big thing with 20 elite penny stocks that balance risk and reward.
- We've uncovered the 9 dividend fortresses yielding 5%+ that don't just survive market storms, but thrive in them.
This article by Simply Wall St is general in nature. We provide commentary based on historical data and analyst forecasts only using an unbiased methodology and our articles are not intended to be financial advice. It does not constitute a recommendation to buy or sell any stock, and does not take account of your objectives, or your financial situation. We aim to bring you long-term focused analysis driven by fundamental data. Note that our analysis may not factor in the latest price-sensitive company announcements or qualitative material. Simply Wall St has no position in any stocks mentioned.