How Strong Earnings Revisions Amid Volatility Will Impact Dycom Industries (DY) Investors
Dycom Industries, Inc. DY | 0.00 |
- Recently, Dycom Industries reported quarterly revenue of US$1.96 billion and strong year-over-year growth in both sales and net profit, while analysts raised earnings estimates and assigned it a top-tier Zacks Rank #1 based on their revised outlook.
- At the same time, technical signals have turned negative and the stock’s beta of 1.50 highlights elevated volatility, creating a tension between upbeat earnings expectations and short-term trading indicators.
- We’ll now examine how this combination of stronger earnings revisions and robust communications-infrastructure demand may influence Dycom’s broader investment narrative.
The best AI stocks today may lie beyond giants like Nvidia and Microsoft. Find the next big opportunity with these 14 smaller AI-focused companies with strong growth potential through early-stage innovation in machine learning, automation, and data intelligence that could fund your retirement.
Dycom Industries Investment Narrative Recap
To own Dycom Industries, you have to believe that multi-year fiber, broadband and data center buildouts will keep driving demand for its specialty contracting work, despite customer concentration and project-cycle risks. The latest quarter’s strong revenue and profit growth, plus higher analyst earnings estimates, support that story, but the stock’s negative technical signals and elevated beta suggest the immediate share price path around this catalyst and risk mix may not be materially changed by this news.
The most relevant update here is Dycom’s Q1 2027 result, with contract revenues of US$1,964.78 million and meaningful year-over-year earnings growth. This operational momentum, alongside raised full year revenue guidance, ties directly into the core catalyst of accelerating communications infrastructure spending, even as investors weigh shorter term volatility and the possibility that large telecom customers could adjust capital plans.
Yet even with strong earnings revisions, Dycom’s reliance on a few major telecom customers remains a risk investors should be aware of, because...
Dycom Industries' narrative projects $9.7 billion revenue and $607.0 million earnings by 2029. This requires 15.9% yearly revenue growth and a $295.6 million earnings increase from $311.4 million today.
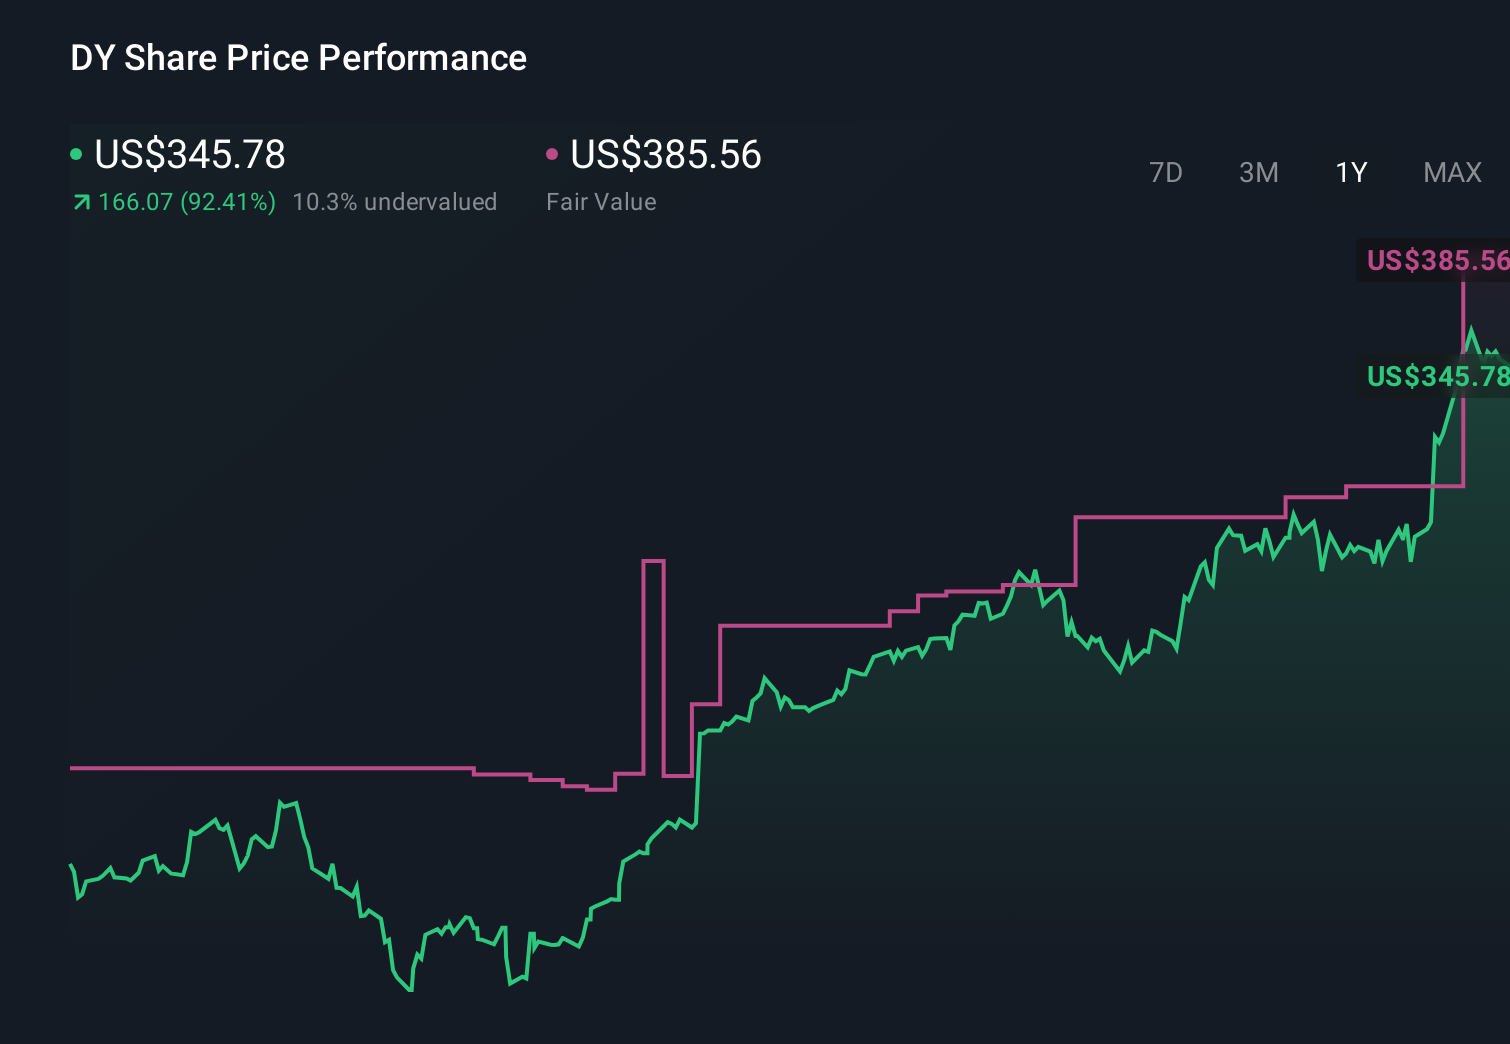
Uncover how Dycom Industries' forecasts yield a $637.27 fair value, a 40% upside to its current price.
Exploring Other Perspectives
Three members of the Simply Wall St Community currently estimate Dycom’s fair value between US$370.92 and US$637.27, reflecting a wide spread of expectations. Set those diverse views against the recent earnings upgrades and infrastructure demand story, and it becomes clear you should weigh several perspectives before forming a view on the company’s prospects.
Explore 3 other fair value estimates on Dycom Industries - why the stock might be worth as much as 40% more than the current price!
Form Your Own Verdict
Don't just follow the ticker - dig into the data and build a conviction that's truly your own.
- A great starting point for your Dycom Industries research is our analysis highlighting 4 key rewards and 1 important warning sign that could impact your investment decision.
- Our free Dycom Industries research report provides a comprehensive fundamental analysis summarized in a single visual - the Snowflake - making it easy to evaluate Dycom Industries' overall financial health at a glance.
Ready For A Different Approach?
Our daily scans reveal stocks with breakout potential. Don't miss this chance:
- This technology could replace computers: discover 31 stocks that are working to make quantum computing a reality.
- Invest in the nuclear renaissance through our list of 89 elite nuclear energy infrastructure plays powering the global AI revolution.
- Find 45 companies with promising cash flow potential yet trading below their fair value.
This article by Simply Wall St is general in nature. We provide commentary based on historical data and analyst forecasts only using an unbiased methodology and our articles are not intended to be financial advice. It does not constitute a recommendation to buy or sell any stock, and does not take account of your objectives, or your financial situation. We aim to bring you long-term focused analysis driven by fundamental data. Note that our analysis may not factor in the latest price-sensitive company announcements or qualitative material. Simply Wall St has no position in any stocks mentioned.