

How Stronger Earnings and Capital Returns At Selective Insurance Group (SIGI) Have Changed Its Investment Story
Selective Insurance Group, Inc. SIGI | 0.00 |
- In July 2026, Selective Insurance Group reported that second-quarter revenue rose to US$1,387.0 million and net income to US$129.4 million, while also declaring quarterly cash dividends on both its common and Series B preferred stock and completing a US$91.93 million share repurchase program begun in October 2025.
- These results showed higher revenue and earnings for both the quarter and first half of 2026 compared with a year earlier, highlighting improved profitability alongside ongoing capital returns to shareholders through dividends and buybacks.
- With this backdrop of higher earnings and continued dividends, we’ll now examine how the latest results may influence Selective’s investment narrative.
We've uncovered the 9 dividend fortresses yielding 5%+ that don't just survive market storms, but thrive in them.
Selective Insurance Group Investment Narrative Recap
To be a shareholder in Selective Insurance Group, you need to believe in its ability to convert disciplined underwriting and operational efficiency into steady earnings, despite pressure from rising casualty claim severities and social inflation. The latest quarter’s higher revenue and net income support the near term catalyst of improved profitability, but they do not remove the key risk that adverse loss trends and reserve uncertainty could still disrupt margins and earnings visibility.
Among the recent announcements, the completion of the US$91.93 million share repurchase program stands out in the context of rising earnings. While buybacks can modestly lift earnings per share, their significance here is secondary to how effectively Selective manages casualty loss trends and reserve adequacy, which remain central to the investment case.
Yet against this improving earnings backdrop, investors should be aware that persistently high casualty claim severities could still...
Selective Insurance Group's narrative projects $5.7 billion revenue and $577.2 million earnings by 2029. This requires 1.5% yearly revenue growth and an $88.7 million earnings increase from $488.5 million.
Uncover how Selective Insurance Group's forecasts yield a $100.71 fair value, a 6% upside to its current price.
Exploring Other Perspectives
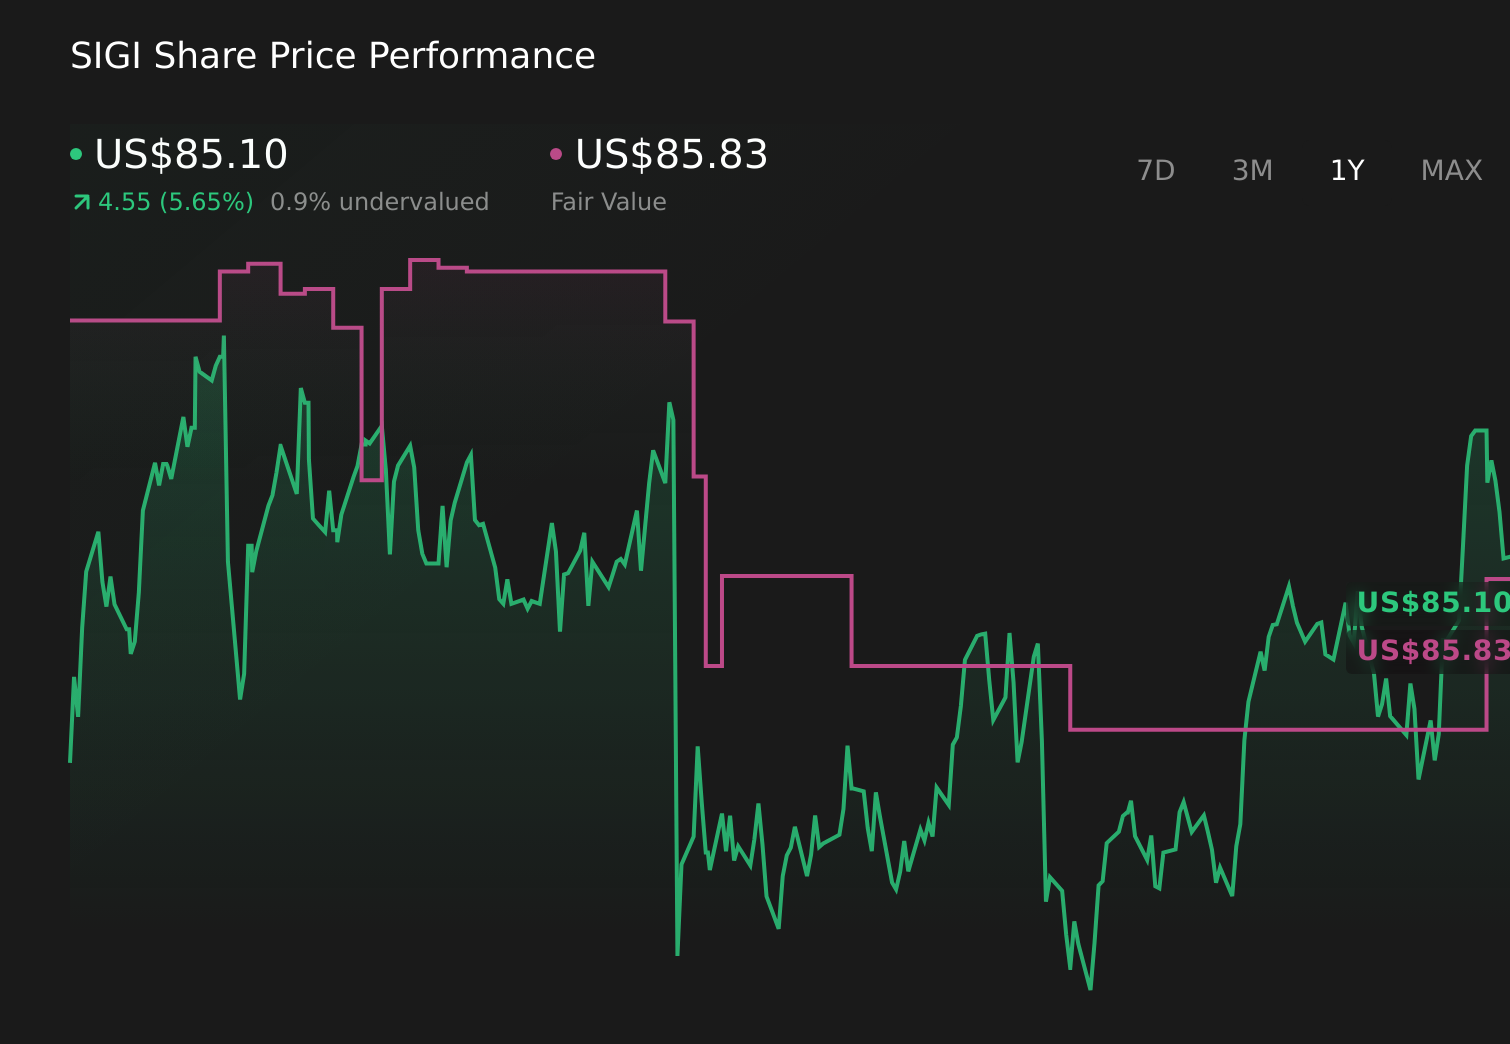
Two fair value estimates from the Simply Wall St Community span a wide range, from about US$100.71 to US$183.39 per share, showing how far apart individual views can be. When you set these against the risk that social inflation and higher claim severities may still lead to earnings volatility, it underlines why exploring several viewpoints on Selective’s future performance can be useful.
Explore 2 other fair value estimates on Selective Insurance Group - why the stock might be worth as much as 93% more than the current price!
Reach Your Own Conclusion
Disagree with existing narratives? Extraordinary investment returns rarely come from following the herd, so go with your instincts.
- A great starting point for your Selective Insurance Group research is our analysis highlighting 4 key rewards and 1 important warning sign that could impact your investment decision.
- Our free Selective Insurance Group research report provides a comprehensive fundamental analysis summarized in a single visual - the Snowflake - making it easy to evaluate Selective Insurance Group's overall financial health at a glance.
Looking For Alternative Opportunities?
Don't miss your shot at the next 10-bagger. Our latest stock picks just dropped:
- Find 55 companies with promising cash flow potential yet trading below their fair value.
- This technology could replace computers: discover 26 stocks that are working to make quantum computing a reality.
- The future of work is here. Discover the 36 top robotics and automation stocks leading the charge in AI-driven automation and industrial transformation.
This article by Simply Wall St is general in nature. We provide commentary based on historical data and analyst forecasts only using an unbiased methodology and our articles are not intended to be financial advice. It does not constitute a recommendation to buy or sell any stock, and does not take account of your objectives, or your financial situation. We aim to bring you long-term focused analysis driven by fundamental data. Note that our analysis may not factor in the latest price-sensitive company announcements or qualitative material. Simply Wall St has no position in any stocks mentioned.