How Sunoco’s (SUN) Higher Quarterly Distribution Could Shape Its Earnings and Cash Flow Story
Sunoco LP SUN | 0.00 |
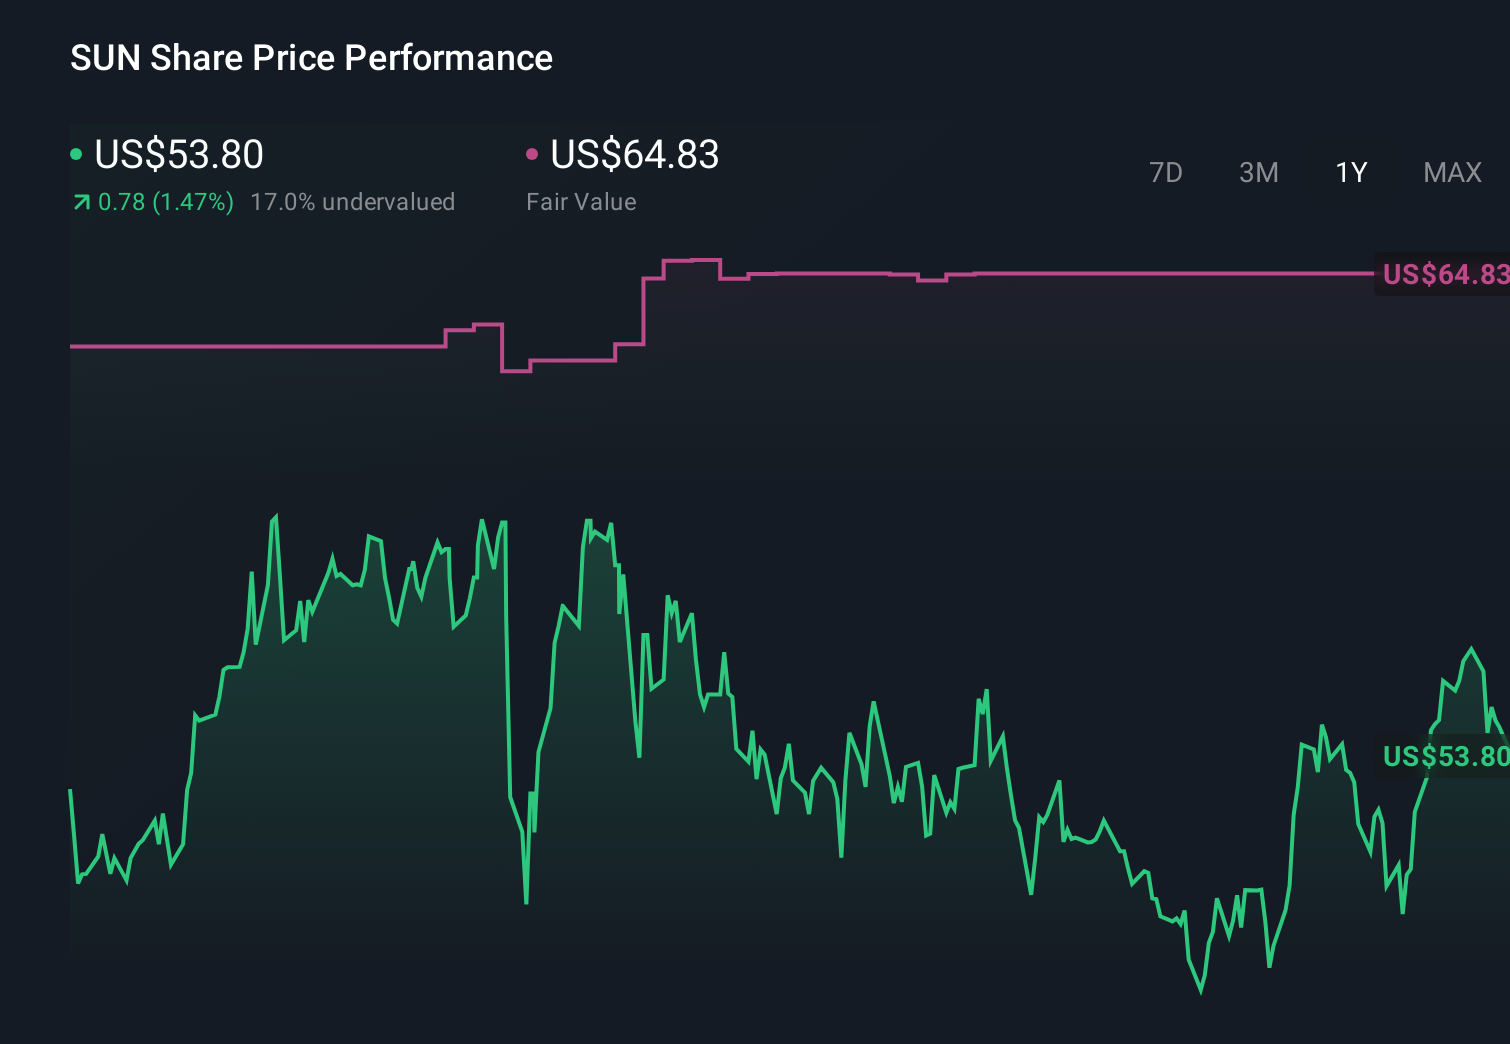
- Earlier this month, Sunoco LP announced a higher quarterly distribution of US$0.9899 per common unit (US$3.9596 annualized) for the March 31, 2026 quarter, a 6.25% increase over the prior quarter, payable on May 20, 2026 to holders of record on May 8, 2026.
- This distribution increase, coming alongside analyst expectations for materially higher near-term earnings, highlights how management is backing up a stronger operating outlook with higher cash returns to unitholders.
- We’ll now examine how this latest distribution increase could influence Sunoco’s investment narrative around earnings visibility, cash flows and growth.
We've uncovered the 14 dividend fortresses yielding 5%+ that don't just survive market storms, but thrive in them.
Sunoco Investment Narrative Recap
To own Sunoco, you need to be comfortable with a fuel distribution business that depends on relatively steady transportation demand while carrying meaningful leverage and exposure to long term energy transition risks. The latest 6.25% distribution increase and expectations for stronger near term earnings support the near term cash flow story, but do not fundamentally change the key short term catalyst, which is execution on recent acquisitions, or the biggest risk around balance sheet flexibility if integration or margins disappoint.
The recent distribution hike sits alongside Mizuho’s higher US$75 price target, which was based on expanded fuel margins and volume gains following the Parkland deal. Together with the upcoming May 5, 2026 earnings release, these updates keep the focus on whether Sunoco can translate its enlarged scale into consistent earnings and distributable cash flow, while managing higher debt costs and integration complexity across NuStar, Parkland and related transactions.
Yet with higher leverage and interest coverage already under pressure, investors should be aware that...
Sunoco's narrative projects $47.8 billion revenue and $1.6 billion earnings by 2029. This requires 23.8% yearly revenue growth and about a $1.3 billion earnings increase from $313.0 million today.
Uncover how Sunoco's forecasts yield a $67.25 fair value, in line with its current price.
Exploring Other Perspectives
Four fair value estimates from the Simply Wall St Community span from about US$47.75 up to US$3,444.12 per unit, showing just how far opinions can stretch. Against that backdrop, the dependence on debt funded acquisitions and the associated integration and leverage risks gives you one concrete angle to compare with these very different views on Sunoco’s potential performance.
Explore 4 other fair value estimates on Sunoco - why the stock might be a potential multi-bagger!
Form Your Own Verdict
Disagree with existing narratives? Extraordinary investment returns rarely come from following the herd, so go with your instincts.
- A great starting point for your Sunoco research is our analysis highlighting 2 key rewards and 3 important warning signs that could impact your investment decision.
- Our free Sunoco research report provides a comprehensive fundamental analysis summarized in a single visual - the Snowflake - making it easy to evaluate Sunoco's overall financial health at a glance.
Searching For A Fresh Perspective?
Early movers are already taking notice. See the stocks they're targeting before they've flown the coop:
- Capitalize on the AI infrastructure supercycle with our selection of the 38 best 'picks and shovels' of the AI gold rush converting record-breaking demand into massive cash flow.
- The future of work is here. Discover the 34 top robotics and automation stocks leading the charge in AI-driven automation and industrial transformation.
- Find 53 companies with promising cash flow potential yet trading below their fair value.
This article by Simply Wall St is general in nature. We provide commentary based on historical data and analyst forecasts only using an unbiased methodology and our articles are not intended to be financial advice. It does not constitute a recommendation to buy or sell any stock, and does not take account of your objectives, or your financial situation. We aim to bring you long-term focused analysis driven by fundamental data. Note that our analysis may not factor in the latest price-sensitive company announcements or qualitative material. Simply Wall St has no position in any stocks mentioned.