How Surging PAPZIMEOS Revenue And Narrower Losses At Precigen (PGEN) Have Changed Its Investment Story
Precigen Inc PGEN | 0.00 |
- In May 2026, Precigen, Inc. reported first-quarter 2026 results showing revenue of US$23.25 million versus US$1.34 million a year earlier and a net loss of US$7.93 million versus US$54.15 million, with loss per share from continuing operations improving to US$0.02 from US$0.18.
- A key driver was the first full quarter of PAPZIMEOS sales, which generated US$21.6 million in net product revenue and highlighted early commercial traction in recurrent respiratory papillomatosis.
- We’ll now examine how PAPZIMEOS’s early commercial momentum and sharply lower quarterly losses affect Precigen’s longer-term investment narrative and assumptions.
We've uncovered the 13 dividend fortresses yielding 5%+ that don't just survive market storms, but thrive in them.
Precigen Investment Narrative Recap
To own Precigen, you need to believe PAPZIMEOS can sustain meaningful uptake in recurrent respiratory papillomatosis and eventually support a profitable, multi-asset gene therapy platform. The Q1 2026 revenue step-up and sharply narrower loss directly support the key near term catalyst of reaching cash flow breakeven by 2026, but they also underline the biggest current risk: heavy fixed costs that still depend on continued PAPZIMEOS growth from a single, early commercial product.
Among recent updates, the company’s disclosure that around 400 patients are enrolled in the PAPZIMEOS hub, with broad U.S. payer coverage and a new permanent J code, is most relevant here. It ties directly to the breakeven narrative by showing early patient pull through and reimbursement access, while also reminding investors that expectations for continued hub conversions and payer support remain central to the thesis.
Yet despite this progress, investors should be aware that if PAPZIMEOS uptake slows or reimbursement tightens, the path to cash flow breakeven could...
Precigen's narrative projects $299.5 million revenue and $118.4 million earnings by 2028. This requires 262.1% yearly revenue growth and a $544.3 million earnings increase from $-425.9 million today.
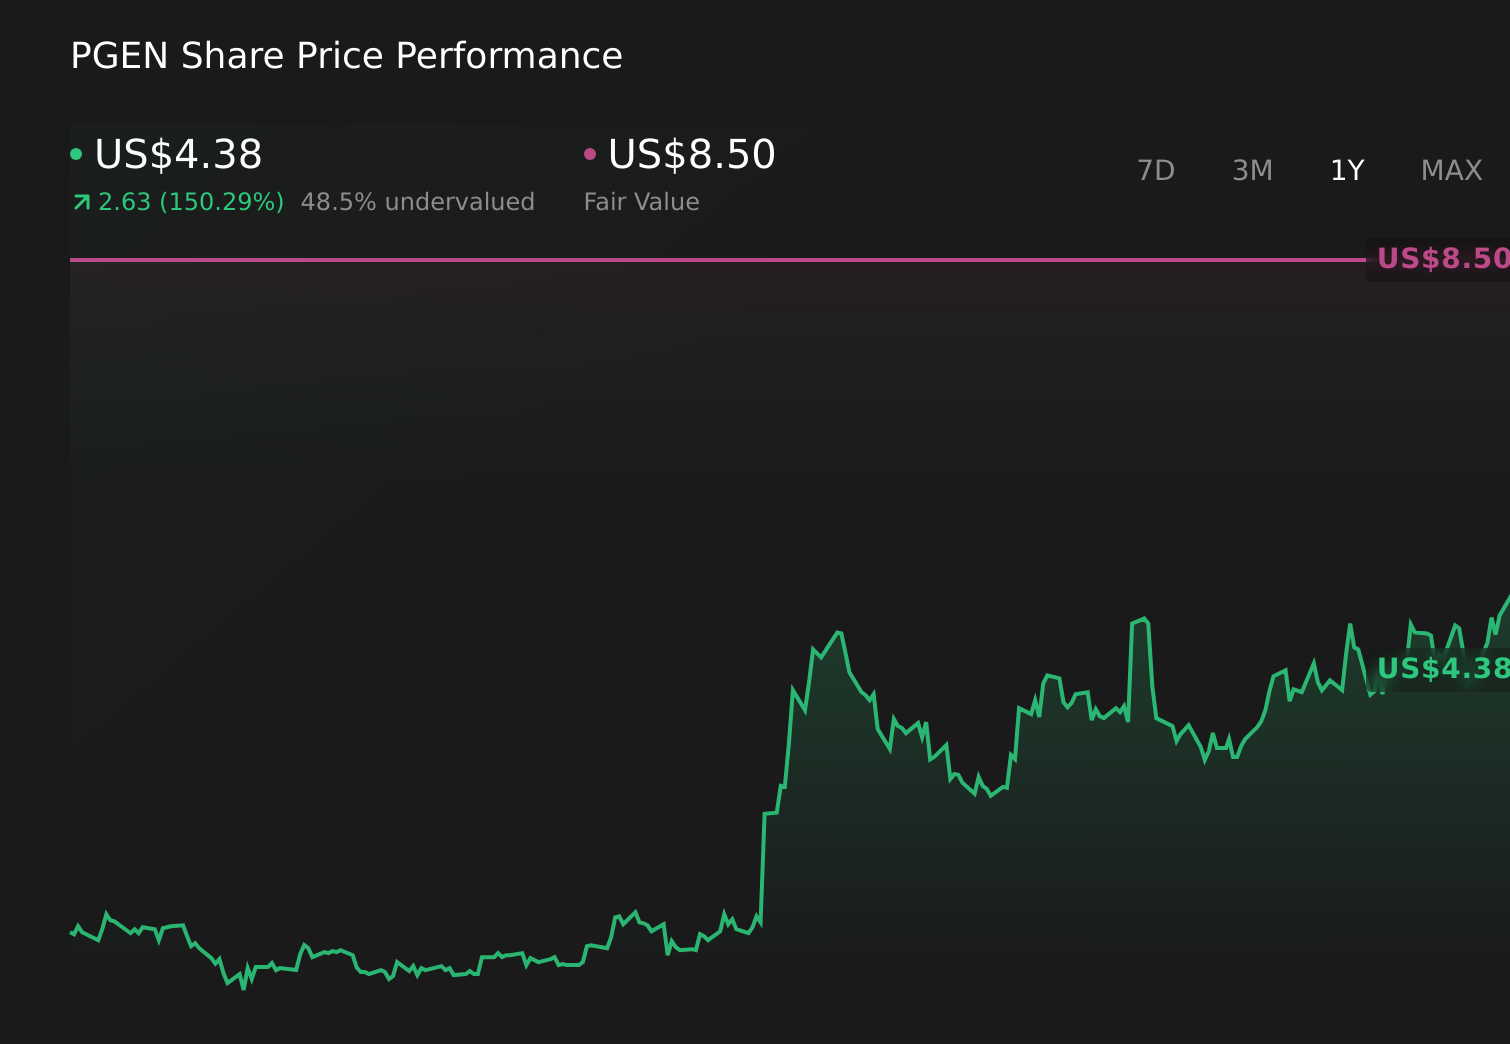
Uncover how Precigen's forecasts yield a $8.50 fair value, a 92% upside to its current price.
Exploring Other Perspectives
Ten members of the Simply Wall St Community currently value Precigen between US$0.52 and US$44.09 per share, reflecting very different expectations. When you set those views against the company’s reliance on PAPZIMEOS to support a move toward breakeven, it underlines how important it is to examine several alternative scenarios for both growth and funding.
Explore 10 other fair value estimates on Precigen - why the stock might be worth less than half the current price!
The Verdict Is Yours
Disagree with existing narratives? Extraordinary investment returns rarely come from following the herd, so go with your instincts.
- A great starting point for your Precigen research is our analysis highlighting 2 key rewards and 4 important warning signs that could impact your investment decision.
- Our free Precigen research report provides a comprehensive fundamental analysis summarized in a single visual - the Snowflake - making it easy to evaluate Precigen's overall financial health at a glance.
Looking For Alternative Opportunities?
Early movers are already taking notice. See the stocks they're targeting before they've flown the coop:
- Invest in the nuclear renaissance through our list of 88 elite nuclear energy infrastructure plays powering the global AI revolution.
- Find 51 companies with promising cash flow potential yet trading below their fair value.
- AI is about to change healthcare. These 32 stocks are working on everything from early diagnostics to drug discovery. The best part - they are all under $10b in market cap - there's still time to get in early.
This article by Simply Wall St is general in nature. We provide commentary based on historical data and analyst forecasts only using an unbiased methodology and our articles are not intended to be financial advice. It does not constitute a recommendation to buy or sell any stock, and does not take account of your objectives, or your financial situation. We aim to bring you long-term focused analysis driven by fundamental data. Note that our analysis may not factor in the latest price-sensitive company announcements or qualitative material. Simply Wall St has no position in any stocks mentioned.