How the Latest AI Partnerships Could Impact Datadog’s Value in 2025
Datadog DDOG | 0.00 |
- If you have ever wondered whether Datadog’s stock is currently a steal or sitting at a premium, you are far from alone. Let’s dig into what might be driving its value.
- Despite a choppy week with the stock dropping 10.2%, Datadog has managed to climb 10.3% year-to-date and is up an impressive 109% over the past three years.
- Recent headlines have centered on Datadog's expansion of its AI-driven monitoring tools and the announcement of new strategic partnerships. These developments have stirred optimism about long-term growth but also contributed to the recent volatility as investors weigh future prospects against near-term uncertainty.
- Right now, Datadog scores a 3 out of 6 on our undervaluation checklist. In the next sections, we’ll break down what that really means across different valuation approaches, with something even better to tie it all together at the end.
Approach 1: Datadog Discounted Cash Flow (DCF) Analysis
The Discounted Cash Flow (DCF) model estimates a company’s intrinsic value by taking projected future cash flows and discounting them to today’s dollars. This approach gives investors a sense of what a business is worth based on its cash-generating potential over time, rather than market sentiment or recent price action.
According to the latest data, Datadog generated $874 million in free cash flow over the last twelve months. Analysts forecast strong growth in the years ahead, with projected free cash flows expected to reach approximately $3 billion by 2029. Further estimates by Simply Wall St suggest over $5.9 billion annually by 2035. These projections are based on both analyst consensus for the next five years and proprietary long-term growth modeling beyond that point.
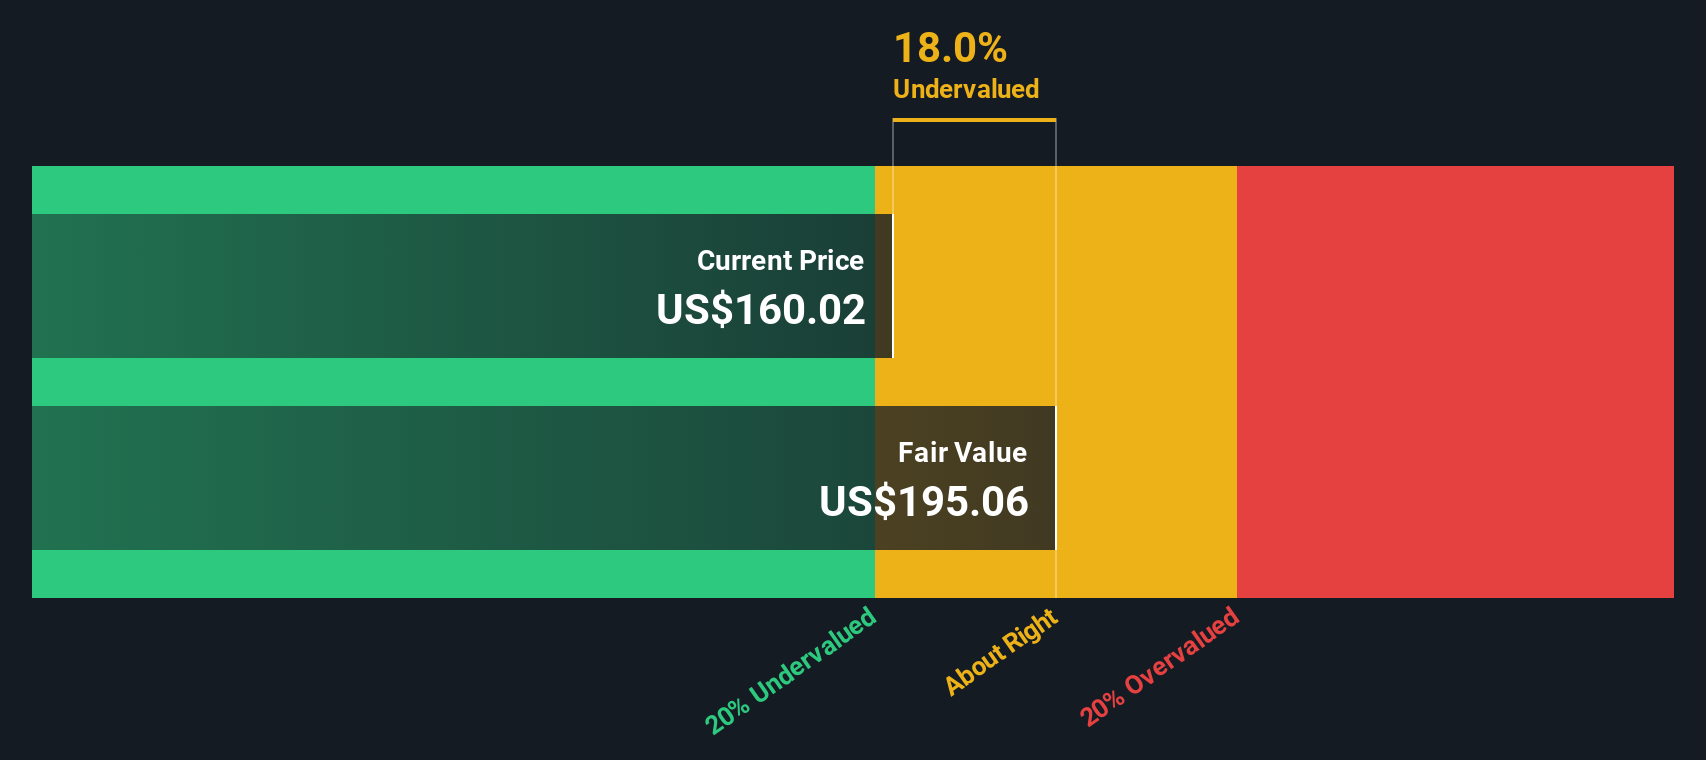
The DCF model result gives Datadog an estimated fair value of $211.44 per share. Compared to current market prices, this suggests the stock is trading at a 25.1% discount, according to model assumptions and projected cash flows. In other words, the current price may not fully reflect Datadog’s future cash generation potential.
Result: UNDERVALUED
Our Discounted Cash Flow (DCF) analysis suggests Datadog is undervalued by 25.1%. Track this in your watchlist or portfolio, or discover 928 more undervalued stocks based on cash flows.
Approach 2: Datadog Price vs Sales
The price-to-sales (P/S) ratio is a widely used metric for valuing technology companies like Datadog, particularly when they are profitable but may still be reinvesting heavily for future growth. The P/S ratio measures how much investors are willing to pay for each dollar of a company’s sales, making it especially useful for high-growth businesses where profits may be modest compared to revenue expansion.
Growth expectations and risk play a big role in determining what constitutes a “normal” or “fair” P/S multiple. Companies with stronger revenue growth, resilient business models, or lower risk profiles typically command higher P/S ratios than slower-growing or riskier peers.
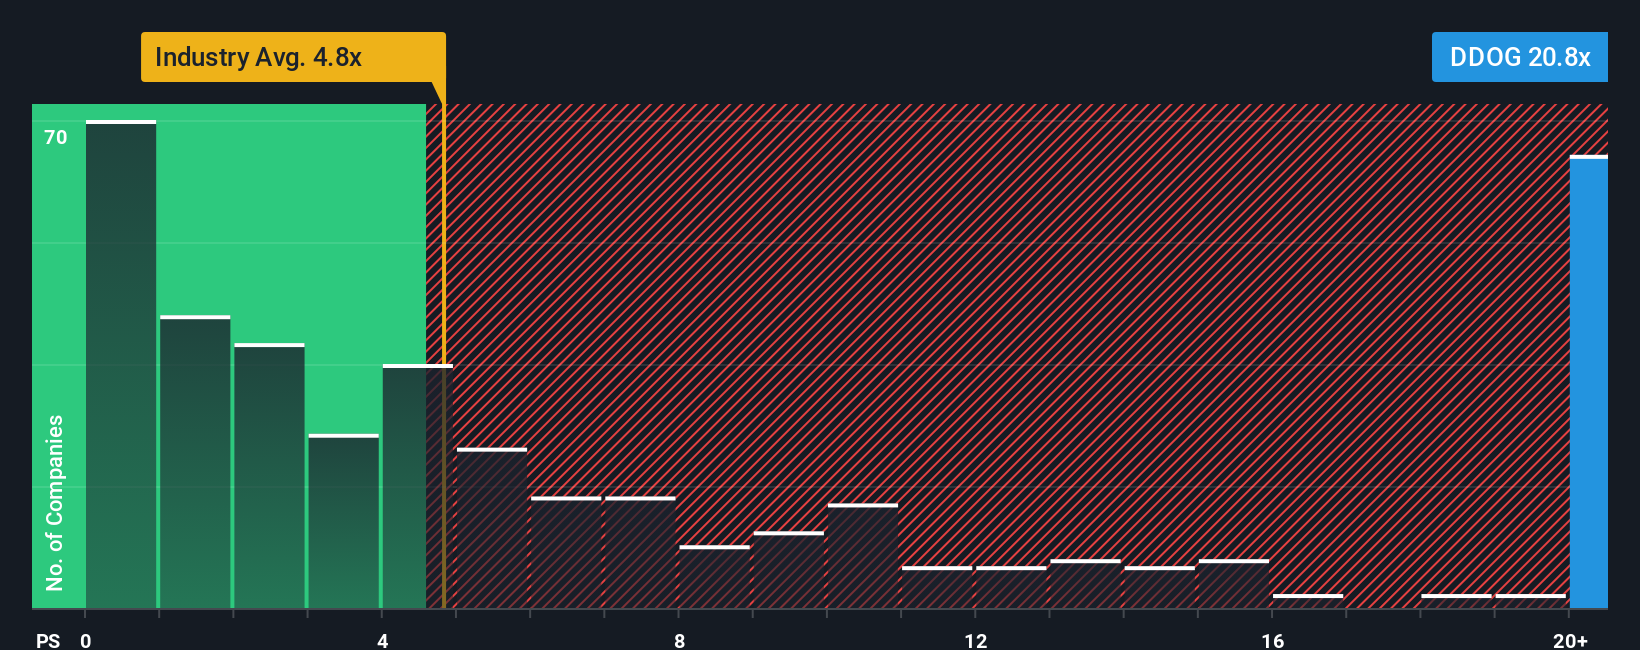
Currently, Datadog trades at a P/S multiple of 17.3x. This is substantially higher than both the Software industry average of 4.7x and the average for its closest peers at 7.2x. However, comparisons like these can be misleading without proper context, since they do not reflect Datadog’s premium growth, margins, or market position.
This is where the Simply Wall St “Fair Ratio” is helpful. Rather than just comparing Datadog to generic benchmarks, the Fair Ratio (calculated to be 15.5x for Datadog) incorporates elements such as projected earnings growth, industry effects, profit margins, company size, and risk factors. This provides a more holistic gauge of what multiple is truly justified for Datadog and helps investors see past simple peer comparisons.
Comparing the actual P/S multiple of 17.3x to the Fair Ratio of 15.5x indicates that Datadog is trading at a slight premium, but the difference is not extreme. By this measure, the stock is priced about right relative to what its fundamentals suggest.
Result: ABOUT RIGHT
PS ratios tell one story, but what if the real opportunity lies elsewhere? Discover 1440 companies where insiders are betting big on explosive growth.
Upgrade Your Decision Making: Choose your Datadog Narrative
Earlier we mentioned that there is an even better way to understand valuation, so let’s introduce you to Narratives. A Narrative is your personal story behind a company's numbers. It ties together your view of Datadog’s future revenue, earnings, and margins to produce a unique fair value estimate.
Narratives connect what’s happening in Datadog’s business and industry with your financial beliefs, then translate those into a fair value that is easy to compare with the current share price. This way, you are not just following data. You are understanding the full story behind the numbers and making grounded, confident investment decisions.
Best of all, Narratives are accessible to everyone using Simply Wall St’s Community page, where millions of investors already share their perspectives. You can instantly see how your fair value stacks up to others', and whenever news or earnings are released, your Narrative and fair value update dynamically with the latest real-world information.
For example, one investor bullish on AI adoption and margin growth might set a Narrative fair value target for Datadog around $200, while another more cautious about customer concentration risk might land closer to $105. Narratives empower you to see, share, and refine your view, making your investment decisions more personal, transparent, and dynamic than ever before.
Do you think there's more to the story for Datadog? Head over to our Community to see what others are saying!
This article by Simply Wall St is general in nature. We provide commentary based on historical data and analyst forecasts only using an unbiased methodology and our articles are not intended to be financial advice. It does not constitute a recommendation to buy or sell any stock, and does not take account of your objectives, or your financial situation. We aim to bring you long-term focused analysis driven by fundamental data. Note that our analysis may not factor in the latest price-sensitive company announcements or qualitative material. Simply Wall St has no position in any stocks mentioned.