How the Recent AI Partnership Could Influence Nutanix Valuation in 2025
Nutanix, Inc. Class A NTNX | 38.37 | +0.95% |
If you are weighing what to do next with Nutanix stock, you are in good company. Many investors are closely watching this name as it continues to move in intriguing ways. Over the past year, Nutanix has notched a total return of 30.8%, far outpacing the S&P 500 and catching the attention of both growth seekers and value hunters. The stock has seen some volatility recently, with returns slipping a bit over the past 30 and 90 days, but year to date Nutanix is still up roughly 13.6%. That big-picture strength has come alongside solid annual revenue growth of almost 15%, and, perhaps even more impressively, a staggering 71% boost in net income.
Market watchers have pointed to ongoing cloud adoption trends and Nutanix’s latest quarterly results as drivers behind these moves. The company’s shares currently trade at around $69.63, with a price target set by analysts at $92.66. This suggests more room to run, at least in theory. What is really turning heads, though, is how Nutanix stacks up when you crunch the numbers. On our valuation scorecard, Nutanix earns a 5 out of 6, signaling that it is currently undervalued on five different checks.
But what do those valuation checks actually tell us? Are there even better ways to gauge what Nutanix is truly worth? Let’s break down the main valuation approaches, then look at a perspective that may be the most revealing of all.
Nutanix delivered 30.8% returns over the last year. See how this stacks up to the rest of the Software industry.Approach 1: Nutanix Cash Flows
The Discounted Cash Flow (DCF) model estimates what a company is worth by projecting its future free cash flows and then discounting them back to their present value. This method helps investors determine whether a stock is overvalued, undervalued, or priced just about right compared to its future earning power.
For Nutanix, the most recent twelve months saw free cash flow of approximately $763 million. Analysts project that annual free cash flow will grow steadily, reaching around $2.2 billion by 2030. Using a 2-Stage Free Cash Flow to Equity model, the resulting estimated intrinsic value per share for Nutanix is $160.56.
With shares currently trading near $69.63, this DCF estimate suggests Nutanix is about 56.6% undervalued. According to this model, the stock appears to offer significant upside based on its expected growth in free cash flow over the next decade.
Result: UNDERVALUED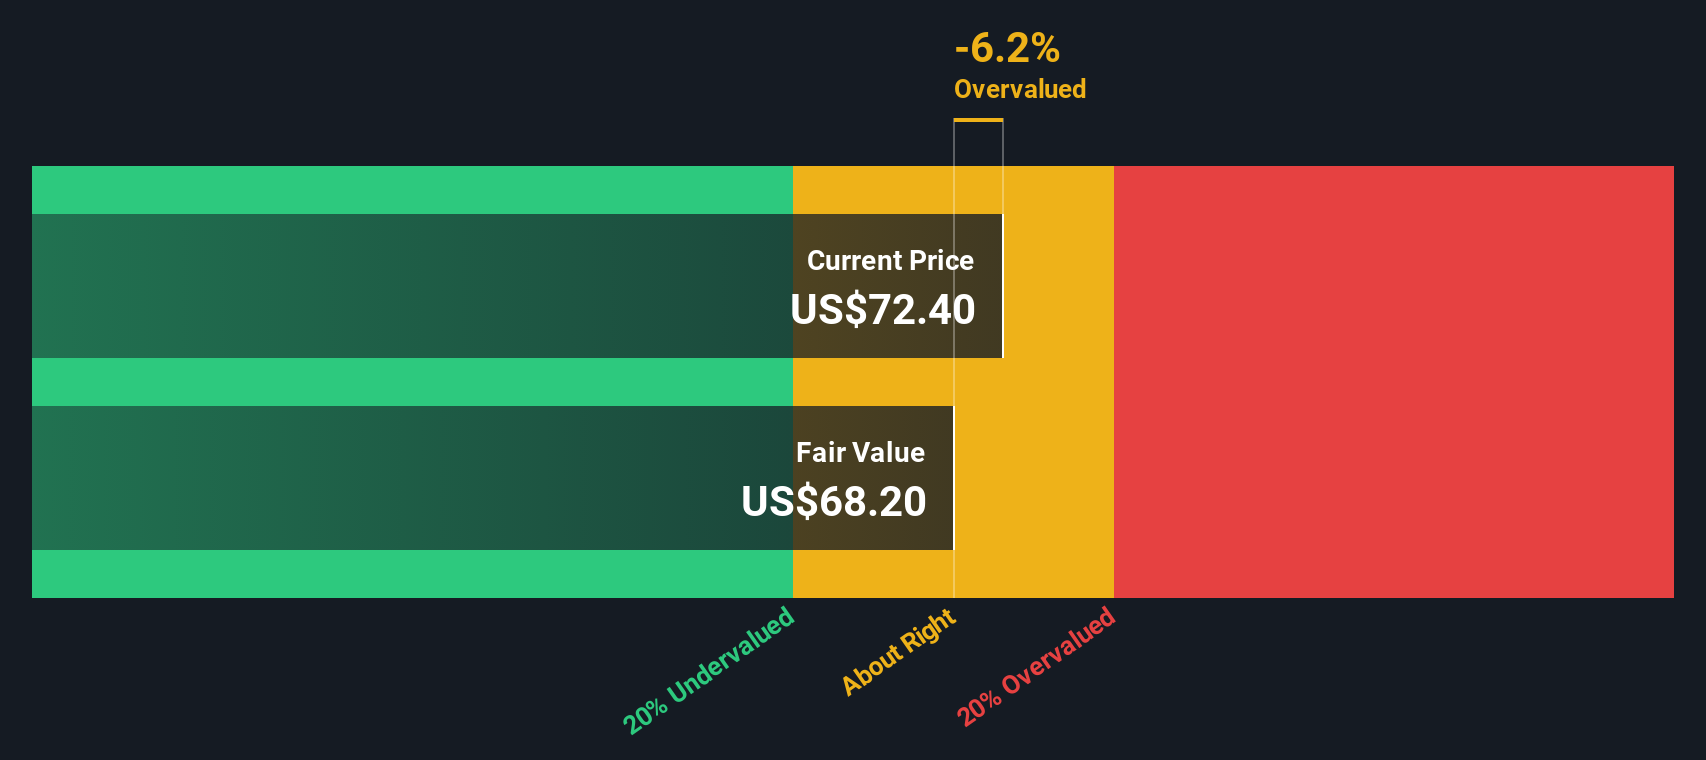
Approach 2: Nutanix Price vs Sales
The Price-to-Sales (P/S) ratio is often the preferred valuation metric for software companies like Nutanix, particularly when profitability is still ramping up or when net income is not the best reflection of business potential. The P/S ratio helps investors gauge what the market is willing to pay for each dollar of revenue. This is especially relevant for high-growth tech companies.
Growth expectations and company risk play a major role in determining what qualifies as a “normal” P/S ratio. Higher expected growth or lower perceived risk tends to justify richer multiples, while slower sales growth or higher uncertainty may pull the ratio down closer to market averages.
Currently, Nutanix is trading at a P/S ratio of 7.67x. For context, the average among its industry peers is 11.16x, while the broader software industry average is 4.84x. Simply Wall St’s proprietary Fair Ratio, which factors in Nutanix’s earnings growth, margins, and risks, is 11.52x. With Nutanix’s current ratio sitting well below both its peer average and its Fair Ratio, this suggests the company is being valued at a discount relative to both the industry and what its fundamentals might warrant.
Result: UNDERVALUED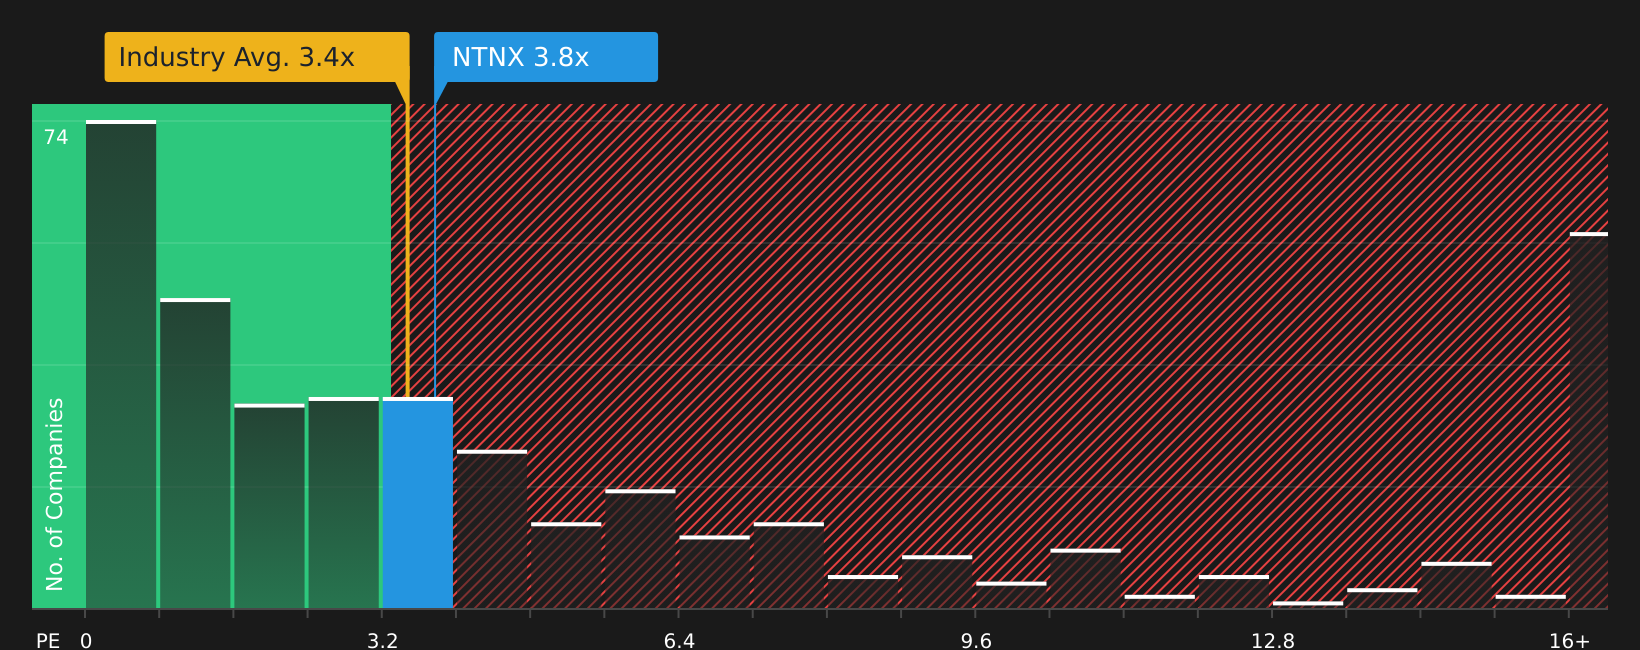
Upgrade Your Decision Making: Choose your Nutanix Narrative
Beyond technical ratios and forecast models, investment decisions can be empowered by "Narratives." These easy-to-build, story-driven perspectives help you explain how changes in Nutanix’s strategy, market trends, or financials might affect its future worth.
A Narrative connects a company’s real-world story to projected revenues and profit margins. This approach allows you to arrive at your own fair value estimate based on your expectations for what could happen next, making the numbers personal, meaningful, and actionable. On Simply Wall St, millions of investors use Narratives to organize their thinking, compare fair value to the current stock price, and get a clear view of whether a stock appears worth further consideration.
What sets Narratives apart is their dynamic nature. Whenever significant news or new results are released, both the numbers and your story’s fair value update instantly, keeping your decision-making aligned with the latest facts. Different investors can have very different perspectives. For example, one Narrative for Nutanix might see new artificial intelligence partnerships as a reason to project margins rising to nearly 16% and a fair value of $92.67. Meanwhile, a more cautious view might expect slower growth and set the fair value closer to $68.61.
Do you think there's more to the story for Nutanix? Create your own Narrative to let the Community know!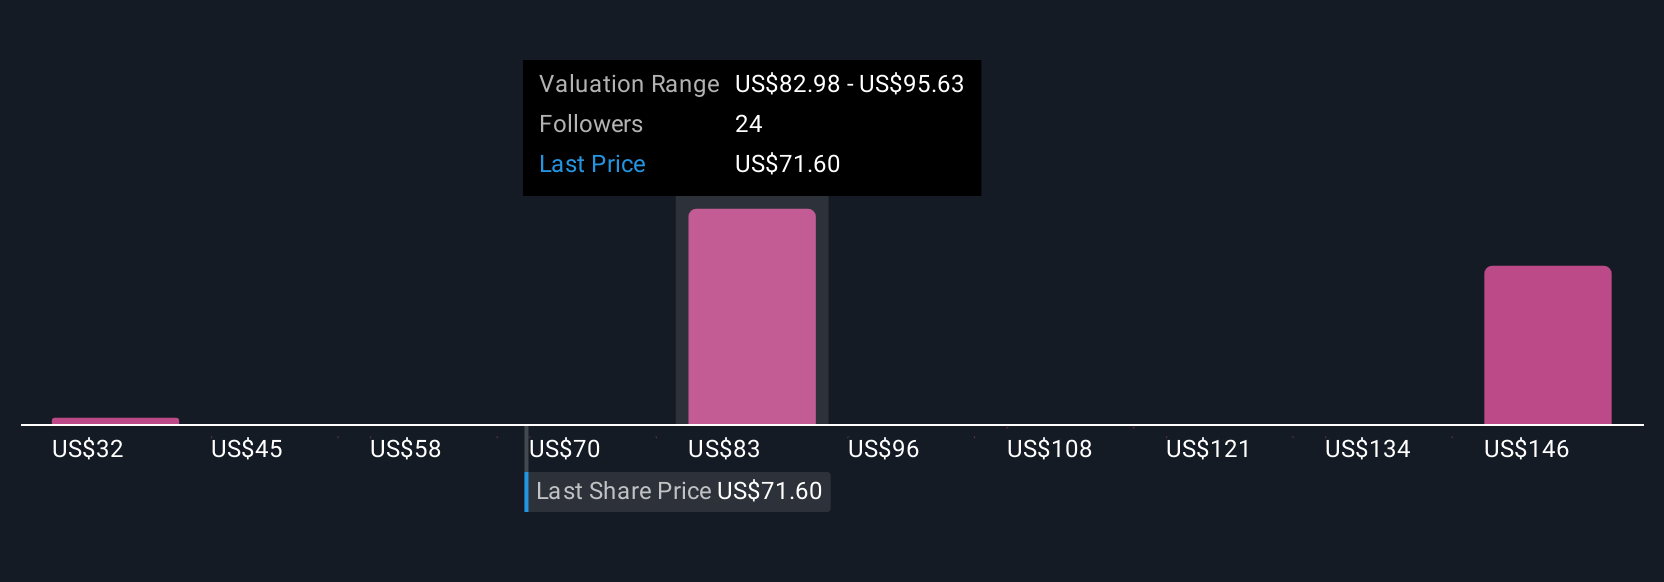
This article by Simply Wall St is general in nature. We provide commentary based on historical data and analyst forecasts only using an unbiased methodology and our articles are not intended to be financial advice. It does not constitute a recommendation to buy or sell any stock, and does not take account of your objectives, or your financial situation. We aim to bring you long-term focused analysis driven by fundamental data. Note that our analysis may not factor in the latest price-sensitive company announcements or qualitative material. Simply Wall St has no position in any stocks mentioned.