Humana (HUM) Valuation Check After Prolonged Share Price Weakness
Humana Inc. HUM | 177.83 | +0.50% |
- If you are wondering whether Humana's current share price reflects its true worth, you are not alone, especially after a tough run for the stock.
- The share price closed at US$207.93, with returns of a 22.4% decline over 7 days, 19.7% decline over 30 days, 21.4% decline year to date, 30.4% decline over 1 year, 58.0% decline over 3 years and 42.3% decline over 5 years.
- Recent coverage of Humana has focused on the pressures facing managed care companies and shifting expectations around health plan costs and utilization. These themes have added context to the share price weakness, as investors reassess how much risk they are taking on in this part of the healthcare sector.
- Against that backdrop, Humana currently scores 5/6 on our valuation checks. This sets up a closer look at how methods like discounted cash flow and multiples stack up, and hints at an even richer way to think about valuation that we will come back to at the end of this article.
Approach 1: Humana Discounted Cash Flow (DCF) Analysis
A Discounted Cash Flow, or DCF, model estimates what a company could be worth today by projecting its future cash flows and discounting them back to the present.
For Humana, the model uses last twelve months free cash flow of about $1.24b and then applies a 2 Stage Free Cash Flow to Equity approach. Analysts provide explicit estimates out to 2030, with projected free cash flow of $4.92b at that point. Beyond those analyst inputs, Simply Wall St extrapolates additional years to complete the 10 year path, with annual projections between roughly $2.54b and $6.19b over 2026 to 2035, each discounted back to today.
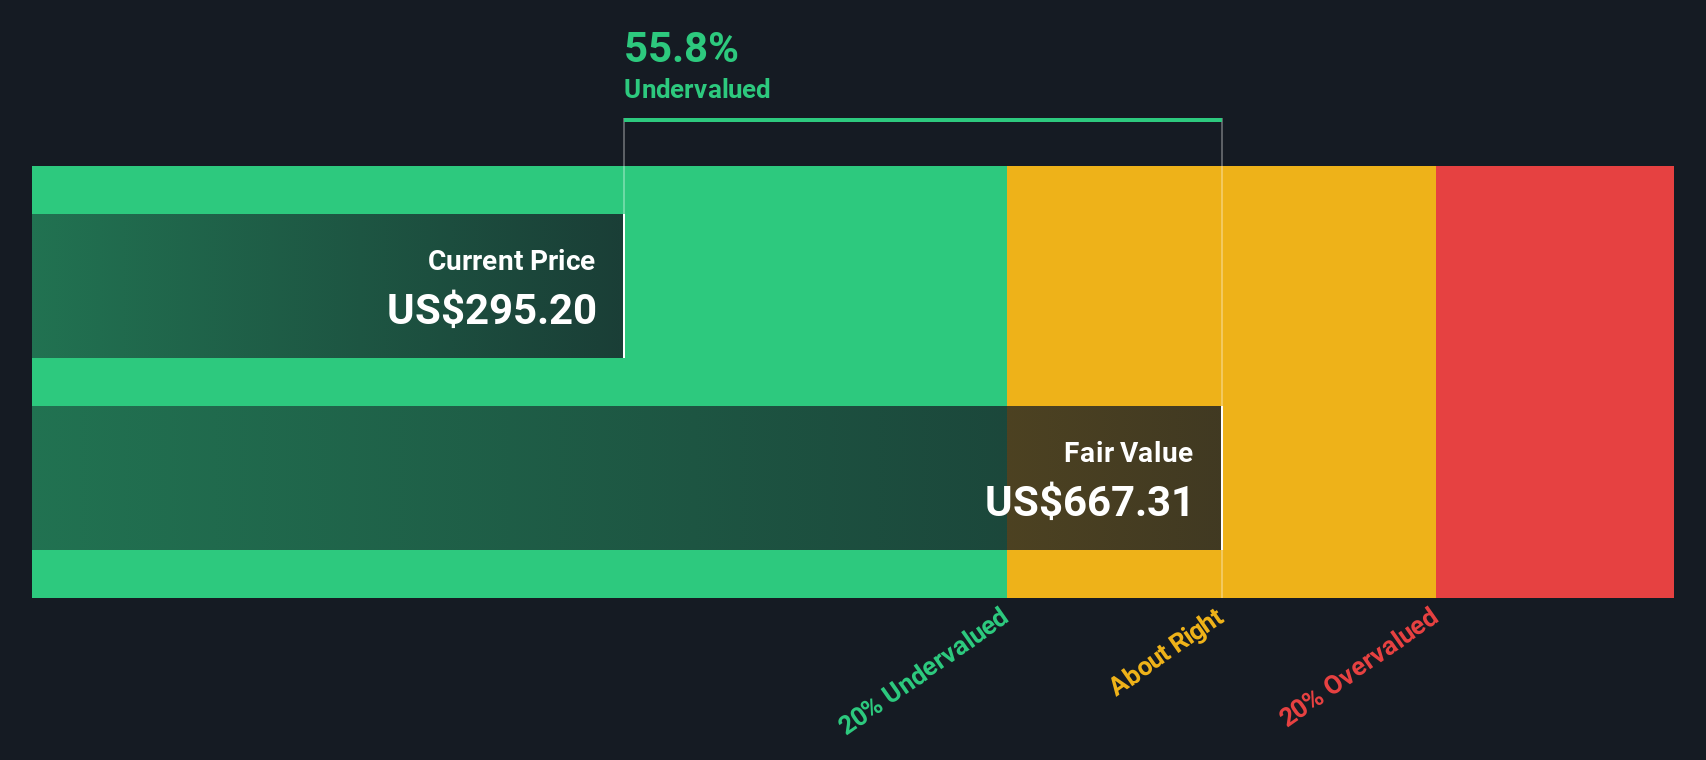
When you add up those discounted cash flows, the model arrives at an estimated intrinsic value of about $999.29 per share. Compared with the recent share price of $207.93, this implies a 79.2% discount, which indicates that the stock screens as materially undervalued on this DCF view.
Result: UNDERVALUED
Our Discounted Cash Flow (DCF) analysis suggests Humana is undervalued by 79.2%. Track this in your watchlist or portfolio, or discover 881 more undervalued stocks based on cash flows.
Approach 2: Humana Price vs Earnings
For a profitable company like Humana, the P/E ratio is a straightforward way to connect what you pay per share with the earnings the business is already generating. It helps you see how much the market is currently paying for each dollar of earnings.
What counts as a "normal" P/E depends on how fast investors expect earnings to grow and how much risk they see in those earnings. Higher expected growth or lower perceived risk can justify a higher P/E, while lower growth or higher risk usually lines up with a lower P/E.
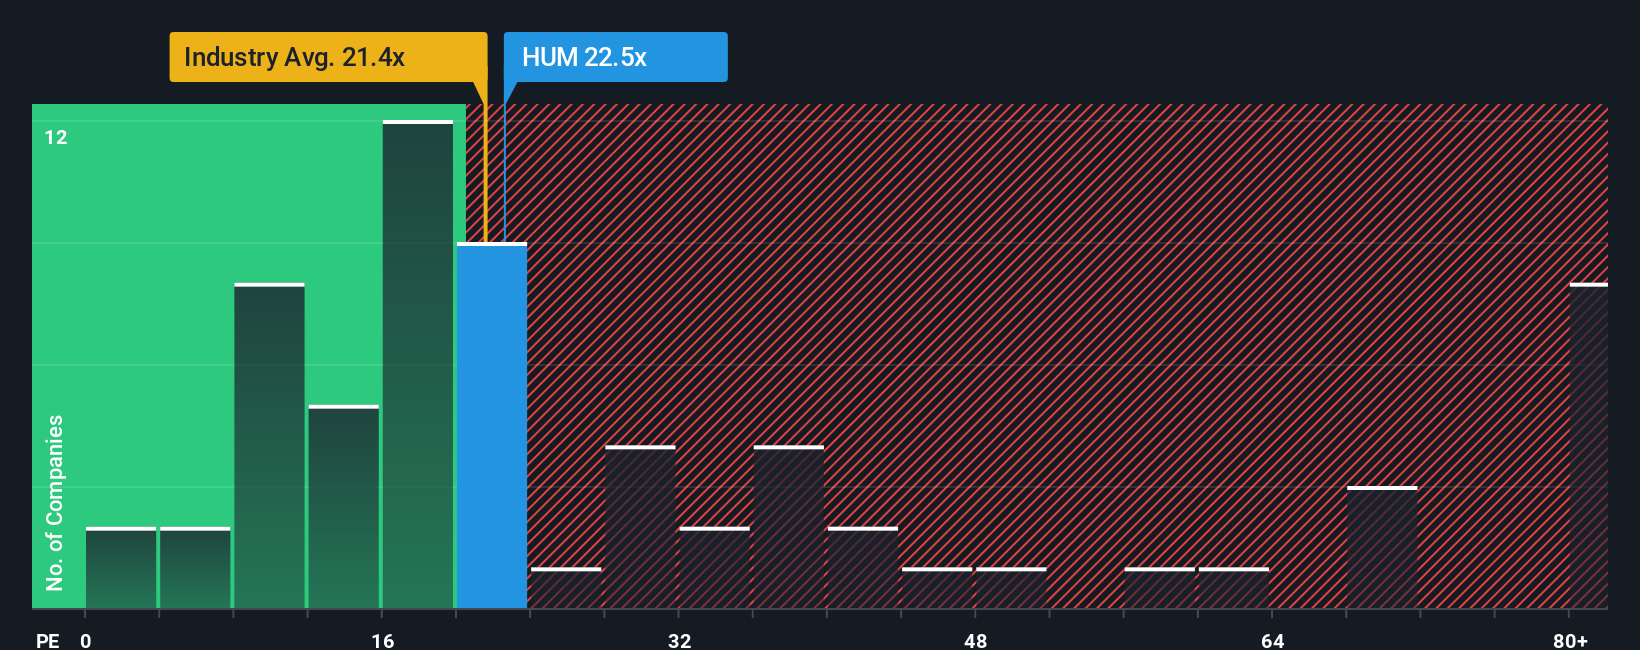
Humana currently trades on a P/E of 19.37x. That sits slightly above the peer average of 18.81x and below the broader Healthcare industry average of 23.43x. Simply Wall St also calculates a Fair Ratio of 36.82x for Humana. This Fair Ratio is a proprietary estimate of the P/E that might be appropriate given factors such as earnings growth, industry, profit margins, market cap and risk profile.
Because the Fair Ratio rolls those company specific factors together, it can be more tailored than a simple comparison with peers or the industry. With Humana’s current P/E of 19.37x sitting below the Fair Ratio of 36.82x, the shares appear undervalued on this metric.
Result: UNDERVALUED
P/E ratios tell one story, but what if the real opportunity lies elsewhere? Discover 1426 companies where insiders are betting big on explosive growth.
Upgrade Your Decision Making: Choose your Humana Narrative
Earlier we mentioned that there is an even better way to understand valuation, so let us introduce you to Narratives.
A Narrative is simply your own story about Humana that sits behind the numbers, where you spell out what you think is a reasonable fair value and what you expect for future revenue, earnings and margins.
On Simply Wall St, Narratives live in the Community page and connect that story to a full forecast, then to a fair value that you can compare directly with today’s share price to help you judge whether Humana looks expensive, cheap or somewhere in between for you.
Because Narratives on the platform are refreshed when new information such as news or earnings is added, your view can stay current without you having to rebuild everything from scratch. You can also see how other investors’ Narratives on Humana span a wide range of fair values when they plug in different assumptions, even though they are all looking at the same company.
Do you think there's more to the story for Humana? Head over to our Community to see what others are saying!
This article by Simply Wall St is general in nature. We provide commentary based on historical data and analyst forecasts only using an unbiased methodology and our articles are not intended to be financial advice. It does not constitute a recommendation to buy or sell any stock, and does not take account of your objectives, or your financial situation. We aim to bring you long-term focused analysis driven by fundamental data. Note that our analysis may not factor in the latest price-sensitive company announcements or qualitative material. Simply Wall St has no position in any stocks mentioned.