Inter & Co (INTR) Is Down 21.7% After Embracing Rule of 50 Profitability Framework – Has The Bull Case Changed?
Inter & Co., Inc. Class A INTR | 0.00 |
- Inter & Co, Inc. reported first-quarter 2026 net income of R$394.79 million, up from R$286.59 million a year earlier, with basic and diluted earnings per share from continuing operations rising to R$0.89 from R$0.65.
- The company also recently adopted the “Rule of 50” as its main framework for balancing growth and return on equity over the next three years, signaling a sharper focus on credit penetration, deposit growth and primary-bank relationships.
- We’ll now examine how Inter & Co’s shift to the Rule of 50 profitability framework could influence its existing investment narrative.
The best AI stocks today may lie beyond giants like Nvidia and Microsoft. Find the next big opportunity with these 16 smaller AI-focused companies with strong growth potential through early-stage innovation in machine learning, automation, and data intelligence that could fund your retirement.
Inter & Co Investment Narrative Recap
To own Inter & Co, you need to believe its super-app model can turn rapid customer and revenue growth into sustained, improving profitability while managing credit risk in Brazil’s competitive digital banking arena. The latest Q1 2026 earnings beat adds support to the earnings side of that story, but the share price slump and high bad-loan ratio keep asset quality and market sentiment as the key short term swing factors.
The company’s decision to adopt the “Rule of 50” as its main framework directly links revenue growth and return on equity targets, which matters for how you think about both upside and risk. It effectively puts profitability discipline alongside expansion goals like credit penetration and deposit growth, making it easier to judge whether rising earnings are being achieved without stretching the balance sheet or underwriting standards.
Yet, against these positives, investors should still be aware of how quickly rising non performing loans could...
Inter & Co's narrative projects R$15.4 billion revenue and R$3.1 billion earnings by 2029. This requires 36.9% yearly revenue growth and an earnings increase of about R$1.8 billion from R$1.3 billion today.
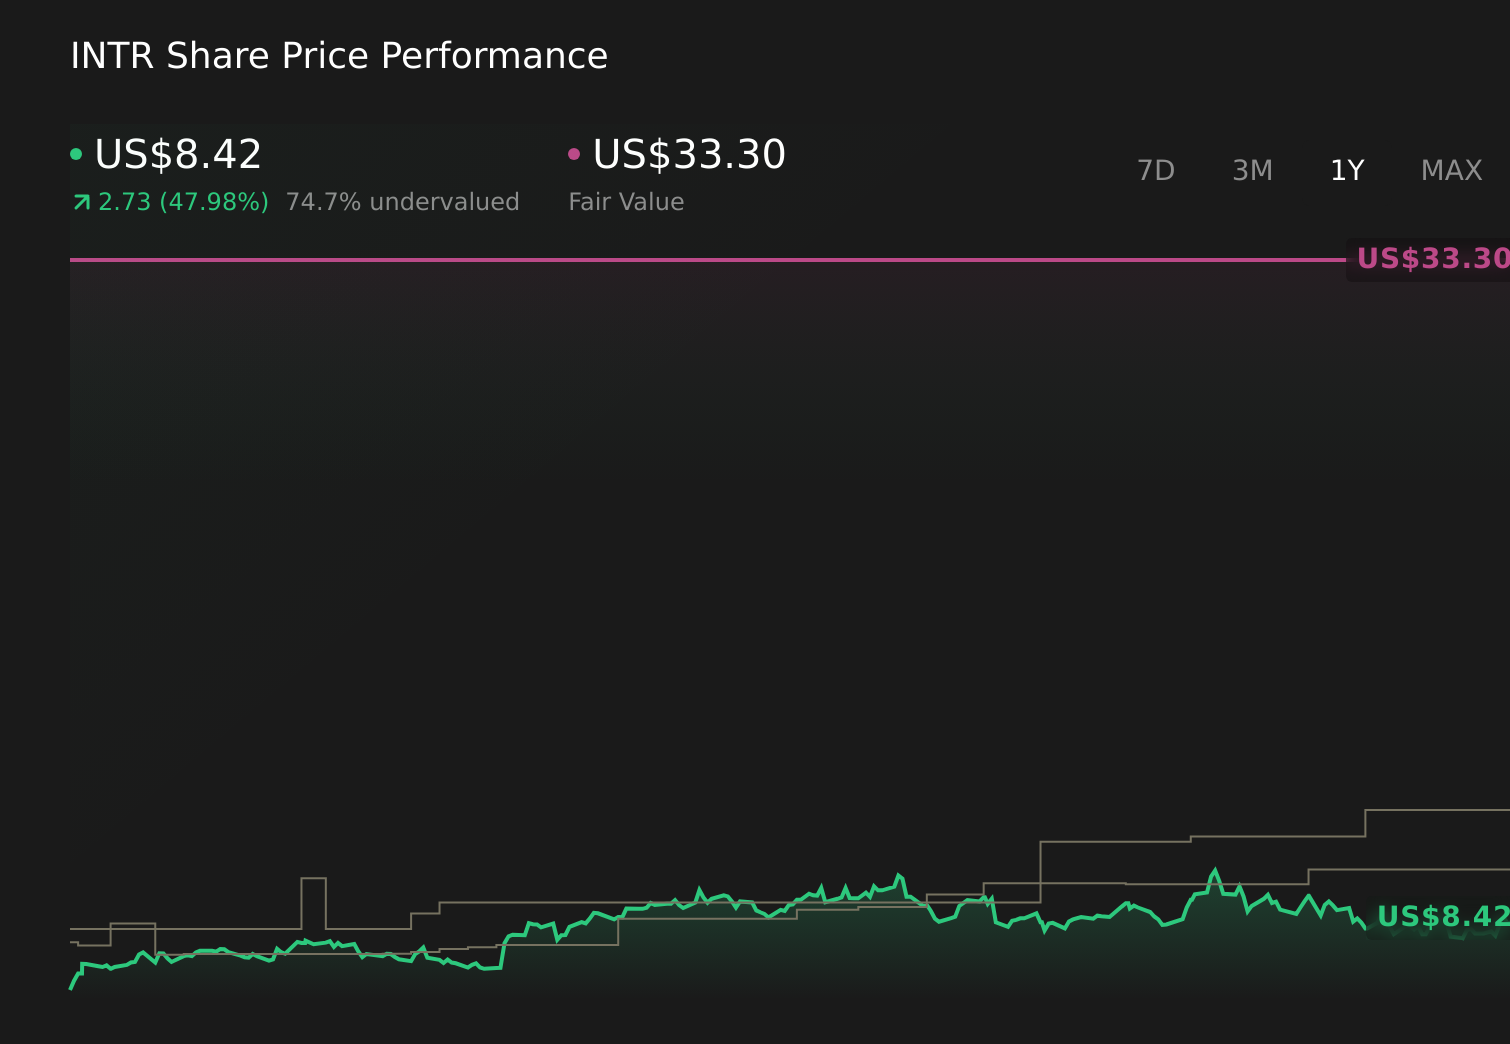
Uncover how Inter & Co's forecasts yield a $10.44 fair value, a 70% upside to its current price.
Exploring Other Perspectives
Some analysts were already far more optimistic, assuming revenue could rise about 42 percent a year and earnings reach roughly R$3.5 billion, but Q1’s results and the Rule of 50 focus might either support that view or prompt a rethink, especially if you worry about rising compliance costs and tighter data rules eating into returns.
Explore 5 other fair value estimates on Inter & Co - why the stock might be worth just $9.74!
Reach Your Own Conclusion
Don't just follow the ticker - dig into the data and build a conviction that's truly your own.
- A great starting point for your Inter & Co research is our analysis highlighting 3 key rewards and 2 important warning signs that could impact your investment decision.
- Our free Inter & Co research report provides a comprehensive fundamental analysis summarized in a single visual - the Snowflake - making it easy to evaluate Inter & Co's overall financial health at a glance.
Searching For A Fresh Perspective?
Every day counts. These free picks are already gaining attention. See them before the crowd does:
- We've uncovered the 14 dividend fortresses yielding 5%+ that don't just survive market storms, but thrive in them.
- The future of work is here. Discover the 30 top robotics and automation stocks leading the charge in AI-driven automation and industrial transformation.
- Capitalize on the AI infrastructure supercycle with our selection of the 39 best 'picks and shovels' of the AI gold rush converting record-breaking demand into massive cash flow.
This article by Simply Wall St is general in nature. We provide commentary based on historical data and analyst forecasts only using an unbiased methodology and our articles are not intended to be financial advice. It does not constitute a recommendation to buy or sell any stock, and does not take account of your objectives, or your financial situation. We aim to bring you long-term focused analysis driven by fundamental data. Note that our analysis may not factor in the latest price-sensitive company announcements or qualitative material. Simply Wall St has no position in any stocks mentioned.