Interactive Brokers Group (IBKR) Stock After 74% Yearly Gain Is There Still Upside?
Interactive Brokers Group, Inc. Class A IBKR | 0.00 |
- If you have ever wondered whether Interactive Brokers Group at around US$88.83 is priced for opportunity or already fully valued, this article is designed to give you a clear, structured view of what the numbers are saying.
- The stock has recently delivered a 2.0% return over the past week, 5.0% over the past month, 32.1% year to date and 74.1% over the last year. This naturally raises questions about how much of the story might already be reflected in the share price.
- Recent coverage has focused on Interactive Brokers Group as a listed broker with global reach, with attention on how its trading platform, client base and capital position fit into a competitive brokerage sector. This context has kept investors focused on whether the current share price properly reflects the company’s scale, business model and risk profile.
- Simply Wall St currently gives Interactive Brokers Group a valuation score of 3/6. The sections that follow will walk through classic methods like P/E and discounted cash flow, before finishing with a broader framework that can help you think about valuation in an even more complete way.
Approach 1: Interactive Brokers Group Excess Returns Analysis
The Excess Returns model looks at how much profit a company can generate over and above the return that shareholders require, based on the equity invested in the business. Instead of focusing on cash flows, it starts with book value, earnings power and the cost of equity, then works out what that implies for value per share.
For Interactive Brokers Group, the model uses a Book Value of $12.54 per share and a Stable EPS estimate of $7.79 per share, based on the median return on equity from the past 5 years. The implied Cost of Equity is $3.61 per share. That leaves an Excess Return of $4.17 per share, which is the profit attributed to shareholders above their required return. The Average Return on Equity of 19.85% and a Stable Book Value estimate of $39.22 per share, based on weighted future book value estimates from 2 analysts, are key inputs.
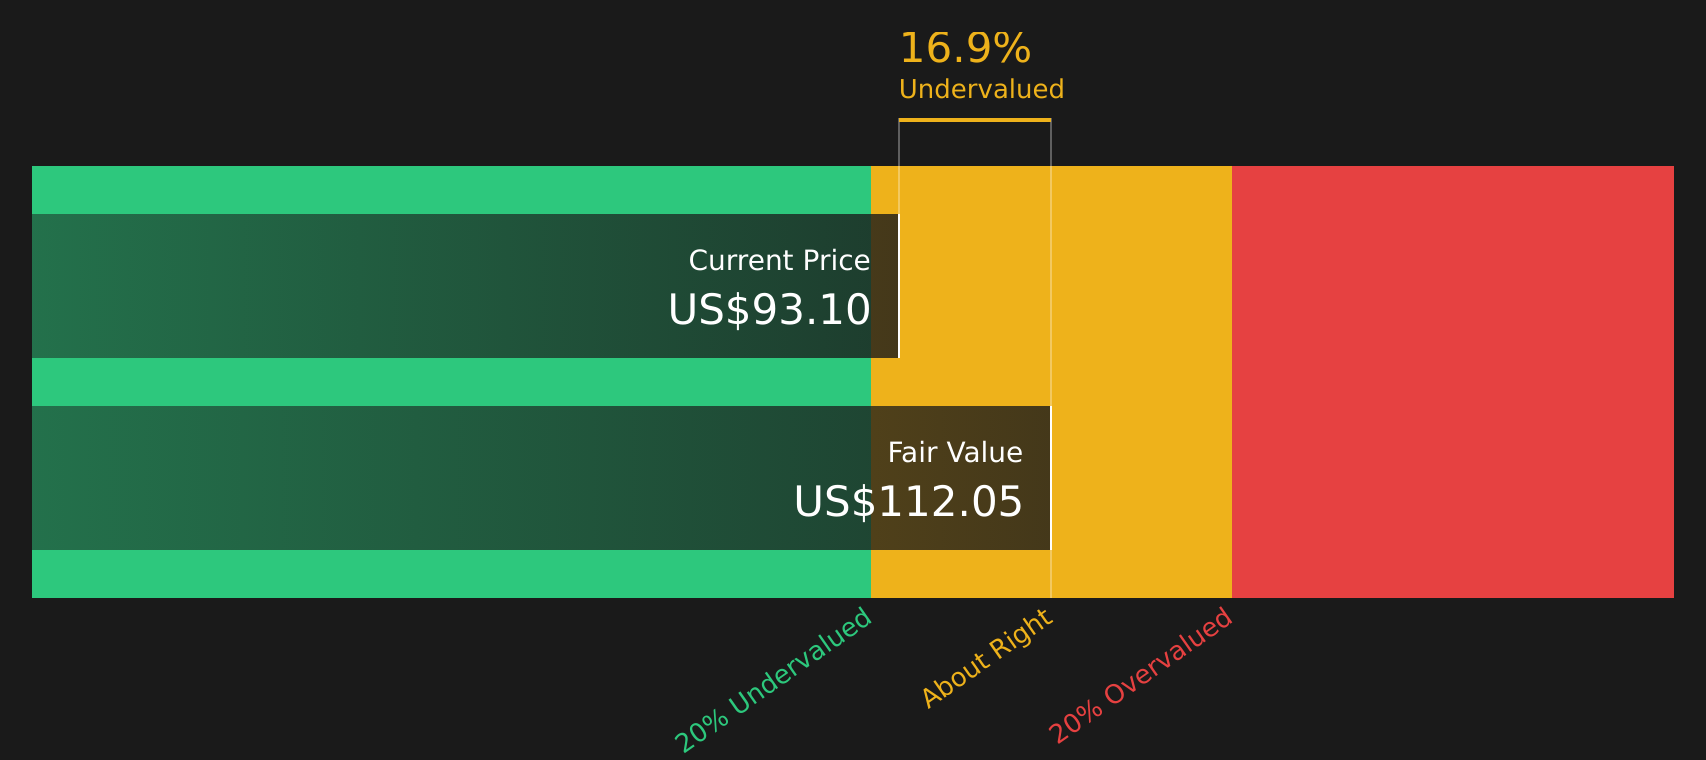
Combining these, Simply Wall St’s Excess Returns model arrives at an intrinsic value of about $112.85 per share, compared with the current share price of about $88.83, implying the stock is 21.3% undervalued.
Result: UNDERVALUED
Our Excess Returns analysis suggests Interactive Brokers Group is undervalued by 21.3%. Track this in your watchlist or portfolio, or discover 46 more high quality undervalued stocks.
Approach 2: Interactive Brokers Group Price vs Earnings
For profitable companies, the P/E ratio is a straightforward way to relate what you pay for a share to the earnings the company is currently generating. It gives you a quick sense of how many years of current earnings are implicitly reflected in the share price.
What counts as a “normal” P/E depends heavily on how the market views a company’s growth potential and risk profile. Higher expected growth or lower perceived risk can support a higher P/E, while slower growth or higher risk usually calls for a lower multiple.
Interactive Brokers Group is trading on a P/E of 38.12x. That sits close to the Capital Markets industry average of 39.52x, but is above the peer group average of 24.66x. Simply Wall St also provides a proprietary “Fair Ratio” of 21.44x, which is the P/E that would typically be expected for a company with Interactive Brokers Group’s earnings growth characteristics, industry, profit margins, market cap and risk factors.
This Fair Ratio is often more informative than a simple comparison with peers or the broad industry, because it adjusts for company specific traits rather than assuming one size fits all. Comparing the current P/E of 38.12x with the Fair Ratio of 21.44x suggests the stock is trading above that fair multiple.
Result: OVERVALUED

Wall Street's queuing for one rocket. While SpaceX counts down to its IPO, other companies tied to the new space race are already in orbit. → 20 Compelling Space Companies watchlist · Global Space Race Investing Ideas screener · Scan the sector by valuation on Rocket Lab's valuation page.
Upgrade Your Decision Making: Choose your Interactive Brokers Group Narrative
Earlier it was mentioned that there is an even better way to understand valuation, so Narratives on Simply Wall St’s Community page let you attach your story about Interactive Brokers Group to the numbers by linking your view of its future revenues, earnings and margins to a fair value that can be compared with the current price. This fair value updates automatically as fresh information such as the Q3 2025 results or new analyst targets come in. One investor might build a bullish Narrative around a fair value near US$109.00 that leans on assumptions like 12.9% annual revenue growth and a 32.2x future P/E. Another might choose a more cautious Narrative closer to US$58.09 or US$64.00 that uses 7.9% growth and a 25.0x future P/E. You can then see in one place how each story translates into a fair value versus today’s share price.
Do you think there's more to the story for Interactive Brokers Group? Head over to our Community to see what others are saying!

This article by Simply Wall St is general in nature. We provide commentary based on historical data and analyst forecasts only using an unbiased methodology and our articles are not intended to be financial advice. It does not constitute a recommendation to buy or sell any stock, and does not take account of your objectives, or your financial situation. We aim to bring you long-term focused analysis driven by fundamental data. Note that our analysis may not factor in the latest price-sensitive company announcements or qualitative material. Simply Wall St has no position in any stocks mentioned.