Interactive Brokers Group (IBKR) Stock After 83% One-Year Surge Is It Still Reasonable
Interactive Brokers Group, Inc. Class A IBKR | 0.00 |
- If you are wondering whether Interactive Brokers Group stock still offers value at around US$96.00, the key question is how that price compares with what the business might reasonably be worth.
- The stock has delivered returns of 8.1% over the last 7 days, 15.0% over the last 30 days, 42.8% year to date and 83.3% over the last year, as well as a very large 3 year and 5 year return that is more than 7x.
- Recent coverage has focused on Interactive Brokers Group as a major electronic brokerage and clearing platform, with investors paying attention to its role in global trading activity and interest in its product offering. These themes help frame how investors are thinking about both the risks and the potential reward implied in the current share price.
- On Simply Wall St's valuation checks, Interactive Brokers Group currently has a value score of 2 out of 6. This raises the issue of which methods of valuation matter most for this stock and also points to a broader way of thinking about value that will be covered at the end of this article.
Interactive Brokers Group scores just 2/6 on our valuation checks. See what other red flags we found in the full valuation breakdown.
Approach 1: Interactive Brokers Group Excess Returns Analysis
The Excess Returns model looks at how much value Interactive Brokers Group creates over and above the return that shareholders require. Instead of focusing on cash flows, it concentrates on the return generated on the company’s equity base compared with its cost of equity.
For Interactive Brokers Group, book value is $12.54 per share and the stable earnings per share are estimated at $7.79, based on the median return on equity from the past 5 years. The average return on equity is 19.85%, while the cost of equity is estimated at $3.21 per share. The difference between these, the excess return, is $4.58 per share. Analysts also estimate a stable book value of $39.22 per share, using weighted future book value estimates from 2 analysts.
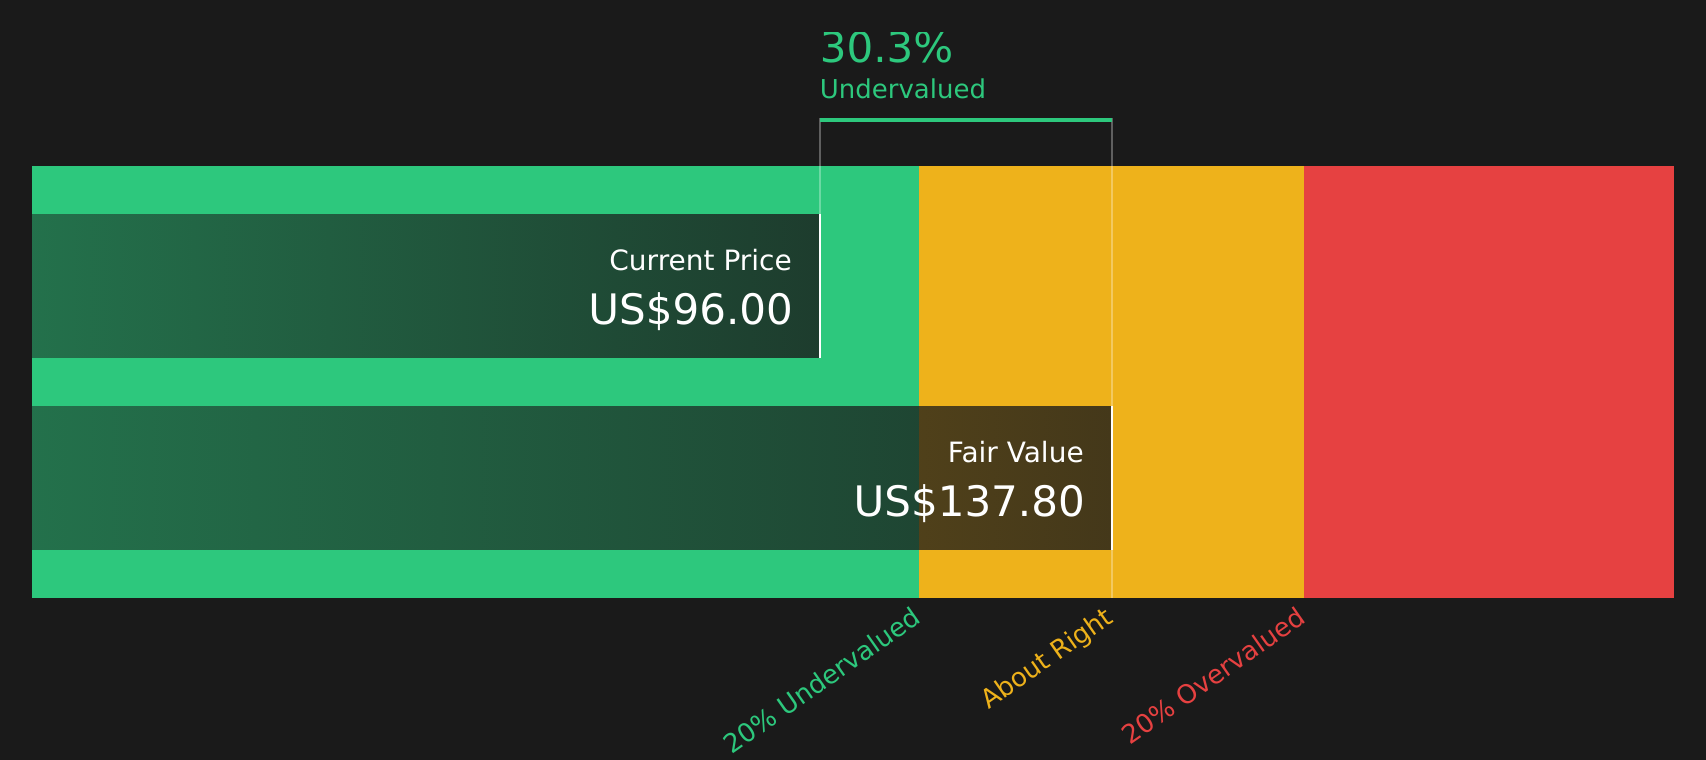
By capitalizing these excess returns on the projected equity base, the Excess Returns model calculates an intrinsic value of $137.80 per share. When this is compared with the recent share price of about $96.00, this framework suggests the stock is 30.3% undervalued.
Result: UNDERVALUED
Our Excess Returns analysis suggests Interactive Brokers Group is undervalued by 30.3%. Track this in your watchlist or portfolio, or discover 45 more high quality undervalued stocks.
Approach 2: Interactive Brokers Group Price vs Earnings
For profitable companies like Interactive Brokers Group, the P/E ratio is a common way to think about what you are paying for each dollar of earnings. It ties the share price directly to current earnings, which many investors use as a starting point when judging whether a stock looks expensive or reasonable.
A “normal” or “fair” P/E tends to reflect what the market expects for future growth and how risky those earnings are perceived to be. Higher expected growth or lower perceived risk can justify a higher P/E, while slower growth or higher risk usually lines up with a lower multiple.
Interactive Brokers Group currently trades on a P/E of 41.20x, compared with a Capital Markets industry average P/E of 40.55x and a peer average of 27.21x. Simply Wall St’s proprietary Fair Ratio for the stock is 21.66x, which is an estimate of what the P/E might be given its earnings growth profile, industry, profit margins, market cap and company specific risks.
The Fair Ratio aims to be more tailored than simple comparisons with industry or peer averages because it incorporates multiple drivers instead of just relative positioning. With the actual P/E of 41.20x vs a Fair Ratio of 21.66x, the shares screen as trading above this fair value range on this metric.
Result: OVERVALUED

P/E ratios tell one story, but what if the real opportunity lies elsewhere? Start investing in legacies, not executives. Discover our 20 top founder-led companies.
Upgrade Your Decision Making: Choose your Interactive Brokers Group Narrative
Earlier it was mentioned that there is an even better way to understand valuation. Narratives on Simply Wall St let you connect your view of Interactive Brokers Group with specific assumptions for future revenue, earnings and margins. You can translate that story into a forecast and Fair Value, and then compare that Fair Value with the current price to decide whether the stock looks appealing or not. All of this is done inside an easy Community page tool that automatically refreshes when new data like earnings or news arrives. For example, one investor might build a bullish Interactive Brokers Group Narrative that aligns with a Fair Value near the higher analyst target of US$109.00, while another might prefer a more cautious Narrative closer to US$58.09. Both investors are using the same framework to turn their story into numbers.
Do you think there's more to the story for Interactive Brokers Group? Head over to our Community to see what others are saying!

This article by Simply Wall St is general in nature. We provide commentary based on historical data and analyst forecasts only using an unbiased methodology and our articles are not intended to be financial advice. It does not constitute a recommendation to buy or sell any stock, and does not take account of your objectives, or your financial situation. We aim to bring you long-term focused analysis driven by fundamental data. Note that our analysis may not factor in the latest price-sensitive company announcements or qualitative material. Simply Wall St has no position in any stocks mentioned.