

Intuitive Surgical (ISRG) Faces Recall Scrutiny, Is The Stock Still Cheap?
Intuitive Surgical, Inc. ISRG | 0.00 |
Intuitive Surgical (ISRG) is under closer scrutiny after a voluntary Class II recall of certain Da Vinci surgical system components, drawing investor attention to product quality controls and potential implications for the stock’s risk profile.
Intuitive Surgical’s share price has come under pressure in recent months, with a 90 day share price return declining 12.86% and a year to date share price return down 27.56%. The 5 year total shareholder return of 31.02% still reflects longer term value creation, suggesting recent momentum has been fading as recalls, softer surgical volume concerns and earnings uncertainty weigh on sentiment.
If you are comparing Intuitive Surgical with other opportunities in medical technology, this could be a good moment to scan for peers using our healthcare focused screener and see what stands out across 40 healthcare AI stocks
Bulls point to Intuitive Surgical’s scale, global reach and ongoing procedure support, while bears focus on recall headlines, softer volume concerns and a stretched valuation. Which side does the current pricing really support as you look at the numbers?
Most Popular Narrative: 23.5% Undervalued
Compared with the last close at $407.12, the most followed narrative for Intuitive Surgical points to a higher fair value, which helps explain why some long term holders remain confident despite recent share price pressure.
A Growing Installed Base is good but the Recurring Revenue makes the Difference
Today, 9,539 da Vinci systems are installed worldwide, with an annual growth rate of 15.1%. Each year, these systems perform approximately 2.2 million procedures, a number that has been growing at a rate of 22.2% per year.
Curious what kind of revenue growth path, profit margins and future earnings multiple sit behind that fair value line and the 6.77% discount rate? The narrative connects a high recurring revenue mix, procedure growth assumptions and a premium future valuation multiple into one cohesive pricing story, but the key numbers only really make sense when you see them laid out step by step.
Result: Fair Value of $532.46 (UNDERVALUED)
However, Intuitive Surgical’s recall scrutiny and any slowdown in procedure volumes or hospital capital spending could quickly challenge a fair value case that is built on high recurring usage.
Another View on Intuitive Surgical’s Valuation
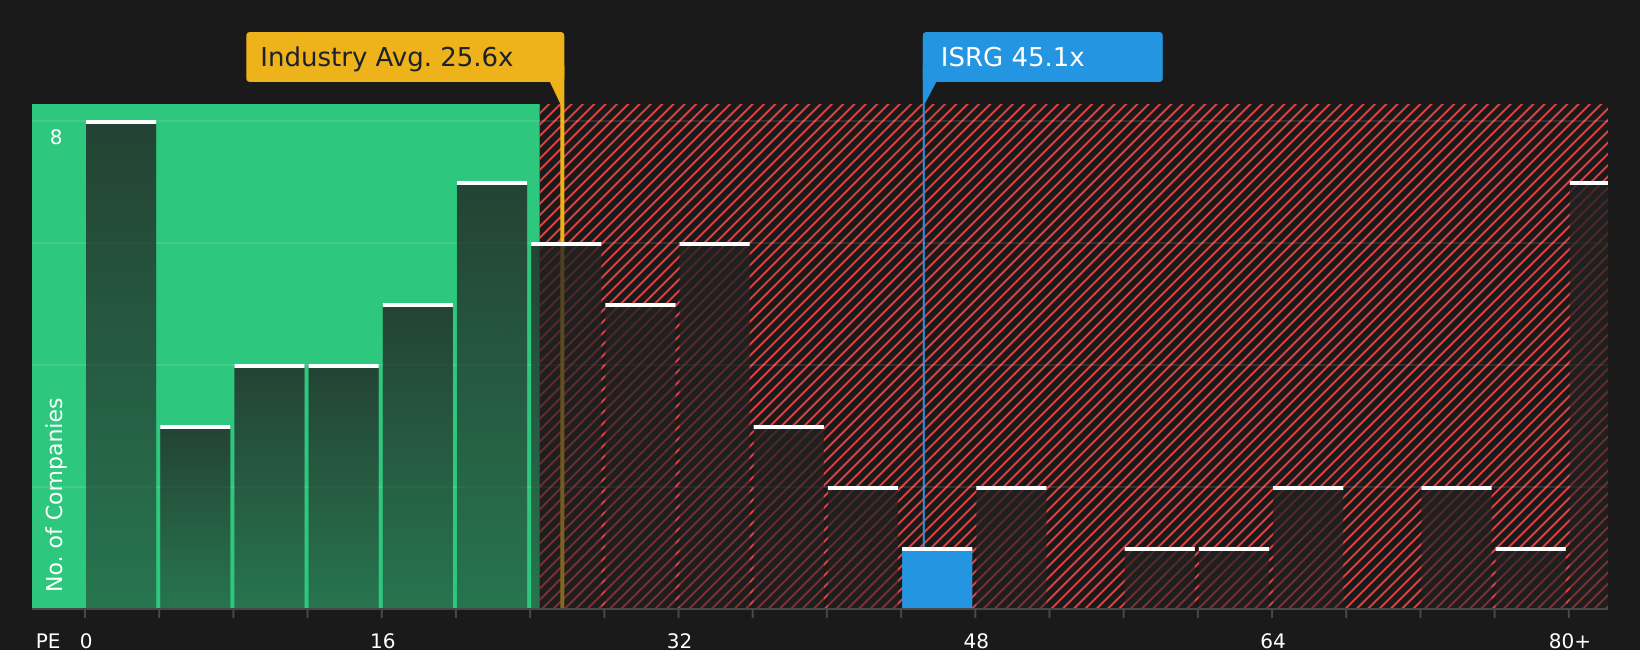
While the user narrative points to Intuitive Surgical trading 23.5% below a $532.46 fair value, the current P/E ratio of 48.4x tells a different story. That multiple sits well above the estimated fair ratio of 33.8x and the US Medical Equipment industry average of 26.2x, which suggests investors are already paying a premium for the stock’s growth profile.
This type of gap can work both ways for you. It can amplify upside if earnings keep meeting expectations, or it can magnify downside if growth or sentiment slip. Which side of that trade off feels more aligned with your risk tolerance?
Next Steps
With sentiment on Intuitive Surgical split between premium pricing and recall risk, this is a moment to act quickly and test the numbers for yourself using the 4 key rewards.
Looking for more investment ideas beyond Intuitive Surgical?
If Intuitive Surgical has sharpened your focus on quality and risk, broaden your watchlist now and give yourself more options before the next market move.
- Spot potential turnaround stories early by reviewing 20 elite penny stocks with strong financials that already show stronger fundamentals than many investors expect.
- Stack the odds toward value by scanning 46 high quality undervalued stocks that pair quality fundamentals with prices that look out of sync with current earnings power.
- Prioritize resilience by reviewing the 80 resilient stocks with low risk scores and see which stocks score well on balance sheet strength and overall risk metrics.
This article by Simply Wall St is general in nature. We provide commentary based on historical data and analyst forecasts only using an unbiased methodology and our articles are not intended to be financial advice. It does not constitute a recommendation to buy or sell any stock, and does not take account of your objectives, or your financial situation. We aim to bring you long-term focused analysis driven by fundamental data. Note that our analysis may not factor in the latest price-sensitive company announcements or qualitative material. Simply Wall St has no position in any stocks mentioned.