Is AdaptHealth (AHCO) Pricing Reflect Its Recent 72.9% One Year Share Price Jump
ADAPTHEALTH CORP AHCO | 0.00 |
To understand what AdaptHealth might be worth to you as an investor, it helps to separate the share price story from the underlying value story. That is what this article sets out to do.
Over the past year, the stock has recorded a 72.9% return, with returns of 2.8% over 7 days, 27.9% over 30 days, and 31.0% year to date, while the 3 year return is 4.5% and the 5 year return is a 57.0% decline, indicating a mixed longer term picture.
Recent company developments and sector sentiment shifts provide important context for these moves. This includes how investors are reacting to AdaptHealth's role in the broader healthcare space and any changes in expectations around its growth or risk profile.
On Simply Wall St's valuation checks, AdaptHealth has a valuation score of 4 out of 6. This opens the door to compare different valuation methods later in this article, and to finish with a perspective on a richer way to think about value beyond a single score.
Approach 1: AdaptHealth Discounted Cash Flow (DCF) Analysis
A Discounted Cash Flow, or DCF, model estimates what a company might be worth today by projecting its future cash flows and then discounting those back to the present using a required return.
For AdaptHealth, the model uses a 2 Stage Free Cash Flow to Equity approach based on cash flow projections. The latest twelve month free cash flow is about $258.8 million. Analysts provide estimates out to 2027, with Simply Wall St extending those projections further. Within this framework, projected free cash flow for 2035 is $274.7 million, which is discounted back to today at $133.3 million. Intermediate years between 2026 and 2034 also contribute to the total equity value.
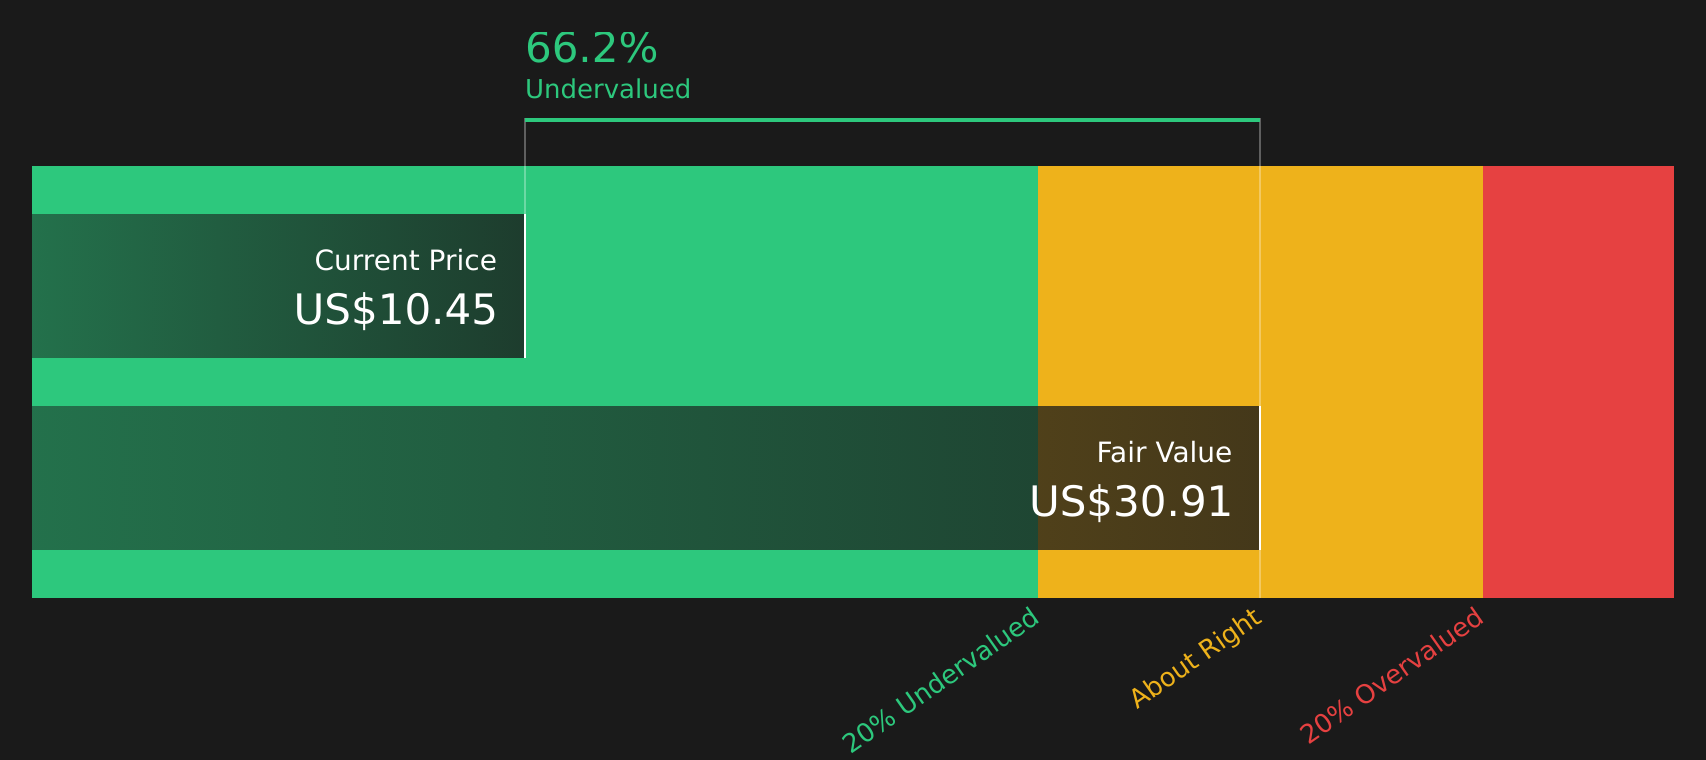
Pulling those discounted figures together, the model arrives at an estimated intrinsic value of $36.74 per share. Compared with the current share price, this implies a 65.5% discount, which points to AdaptHealth trading materially below this DCF estimate.
Result: UNDERVALUED
Our Discounted Cash Flow (DCF) analysis suggests AdaptHealth is undervalued by 65.5%. Track this in your watchlist or portfolio, or discover 63 more high quality undervalued stocks.
Approach 2: AdaptHealth Price vs Sales
For companies where earnings can be uneven, the P/S ratio is often a practical yardstick because it compares the share price to the revenue the business generates, which tends to be more stable than profits.
Growth expectations and risk still matter, because higher expected growth or lower perceived risk can justify a higher “normal” P/S multiple, while lower growth or higher risk often point to a lower one.
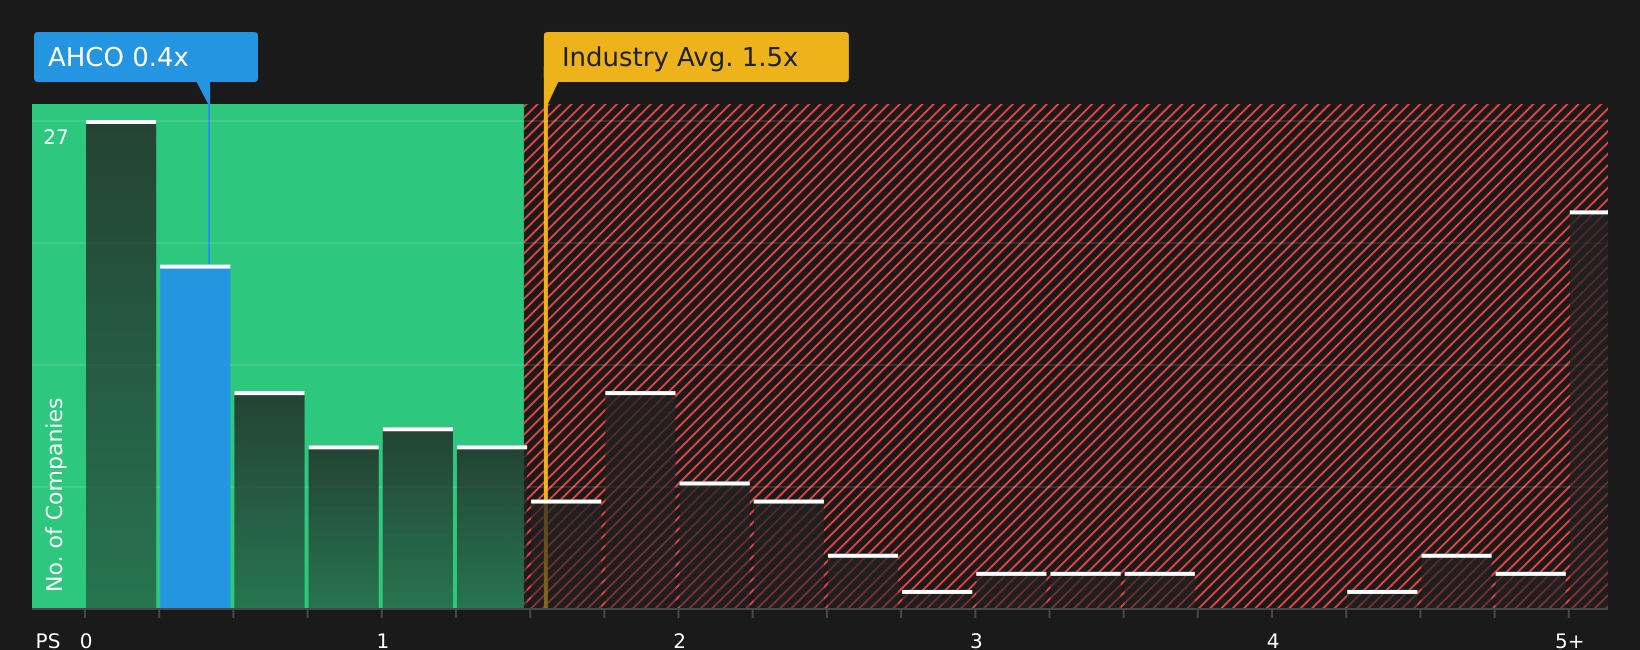
AdaptHealth currently trades on a P/S ratio of 0.53x. This is below the broader Healthcare industry average of 1.20x and slightly above the peer group average of 0.47x. Simply Wall St’s proprietary Fair Ratio for AdaptHealth is 0.60x, which is an estimate of the P/S multiple that might be reasonable given factors such as its earnings growth profile, industry, profit margins, market cap and risk characteristics.
The Fair Ratio aims to be more tailored than a straight comparison with peers or industry averages because it adjusts for company specific drivers like growth, risks and profitability rather than assuming all companies deserve the same multiple.
Comparing the Fair Ratio of 0.60x with the current P/S of 0.53x suggests that AdaptHealth is trading below this Fair Ratio estimate.
Result: UNDERVALUED
P/S ratios tell one story, but what if the real opportunity lies elsewhere? Start investing in legacies, not executives. Discover our 19 top founder-led companies.
Upgrade Your Decision Making: Choose your AdaptHealth Narrative
Earlier it was mentioned that there is an even better way to understand valuation, so Narratives are a simple way for you to plug your view of AdaptHealth into a financial forecast, link that to a fair value, and then compare it with the current share price.
On Simply Wall St's Community page, Narratives let you set assumptions for future revenue, earnings and margins, so you can capture the story you believe, whether that looks closer to a bullish fair value of US$17.0 or a more cautious US$9.50.
Each Narrative turns those assumptions into an estimated fair value and continuously checks it against the live market price. This can help you decide whether AdaptHealth looks closer to a buy, a sell, or a hold for your own portfolio rules.
Narratives update automatically when new news, earnings or guidance are added to the platform. For example, if you think the new US$1b plus capitated contract will drive stronger long term cash generation than the market assumes, your bullish Narrative will reflect that. Another investor might build a more cautious story that stresses reimbursement pressure and infrastructure costs, and both views can sit side by side for you to compare.
For AdaptHealth however we'll make it really easy for you with previews of two leading AdaptHealth Narratives:
Fair value: US$17.00
Gap to fair value vs last close: ((17.0 - 12.67) / 17.0) = 25.5% below this bullish fair value estimate
Revenue growth assumption: 7.77% per year
- Analysts in this camp focus on the new US$1b plus capitated contract, ongoing acquisitions and tech enabled efficiency as potential drivers of higher revenue, margins and cash flow over time.
- The narrative assumes earnings turn around from a loss to US$243.2m by 2029 with profit margins moving from a 2.2% loss to a 6.0% margin, supported by a future P/E of 12.9x, below the current US Healthcare industry P/E of 22.6x.
- Key risks include reimbursement pressure from CMS, execution risk on large contracts, high leverage of US$1.8b net debt, and the possibility that value based care and digital health could weigh on demand or margins.
Fair value: US$9.50
Gap to fair value vs last close: ((12.67 - 9.5) / 9.5) = 33.4% above this bearish fair value estimate
Revenue growth assumption: 5.41% per year
- The cautious view highlights that the same large capitated contract and homecare demand also bring heavier infrastructure spending, higher operating costs and capital expenditure, which could limit free cash flow and margin improvement.
- This narrative assumes revenue grows more slowly, margins reach 4.4% by 2029 and earnings reach US$165.9m, with the shares on a 10.6x P/E, again below the US Healthcare industry P/E of 21.2x.
- Risks flagged here include CMS competitive bidding, payer consolidation, digital health potentially reducing demand for core products, and tougher reimbursement terms that could keep pressure on both revenue growth and profitability.
If you want to go beyond these previews and weigh up which story is closer to your own expectations for contracts, margins and reimbursement risk, See what the community is saying about AdaptHealth.
Do you think there's more to the story for AdaptHealth? Head over to our Community to see what others are saying!

This article by Simply Wall St is general in nature. We provide commentary based on historical data and analyst forecasts only using an unbiased methodology and our articles are not intended to be financial advice. It does not constitute a recommendation to buy or sell any stock, and does not take account of your objectives, or your financial situation. We aim to bring you long-term focused analysis driven by fundamental data. Note that our analysis may not factor in the latest price-sensitive company announcements or qualitative material. Simply Wall St has no position in any stocks mentioned.