Is AllianceBernstein Holding (AB) Fairly Valued Following Its Recent Share Price Weakness?
AllianceBernstein Holding L.P. AB | 0.00 |
AllianceBernstein Holding (AB) stock has drawn attention after recent price moves, with the shares last closing at US$35.78. Investors are weighing this level against the company’s mixed growth profile and current valuation signals.
Recent trading puts AllianceBernstein Holding’s share price under gentle pressure, with the stock down over the past week and month, while the 3 year total shareholder return remains positive. This suggests longer term holders have still seen gains despite the recent softness.
If this recent pullback has you thinking about where else to put fresh capital to work, it could be a good moment to widen your watchlist with 20 top founder-led companies
So with AllianceBernstein Holding’s shares easing in the short term but still ahead over three years, and trading only slightly below some valuation markers, is this a genuine buying opportunity, or is the market already pricing in future growth?
Price-to-Earnings of 10.7x: Is it justified?
On a P/E of 10.7x, AllianceBernstein Holding is priced well below both the US Capital Markets industry average and its direct peer group, even though the shares last closed at $35.78 and trade only slightly below some fair value estimates.
The P/E multiple compares the current share price with earnings per share, so a lower ratio can sometimes point to the market expecting weaker profit trends or assigning a lower quality score to those earnings.
For AllianceBernstein Holding, the picture is mixed. The company has high quality earnings and a 24.7% return on equity, and its P/E of 10.7x is described as good value versus both the US Capital Markets industry on 40.5x and a peer average of 18x. At the same time, that 10.7x is higher than an estimated fair P/E of 8.8x that our models suggest the market could move toward if sentiment and fundamentals converge.
Relative to the broader sector, the discount is clear, with AllianceBernstein Holding trading on less than a third of the industry average P/E. Yet compared with the internal fair ratio estimate, the stock screens as somewhat expensive on this particular yardstick, highlighting the tension between how peers are valued and where its own earnings multiple might settle if expectations shift.
Result: Price-to-Earnings of 10.7x (ABOUT RIGHT)
However, AllianceBernstein Holding’s revenue and net income trends point in different directions, and recent share price weakness could signal investors reassessing that growth and earnings profile.
Another View: SWS DCF fair value for AllianceBernstein Holding
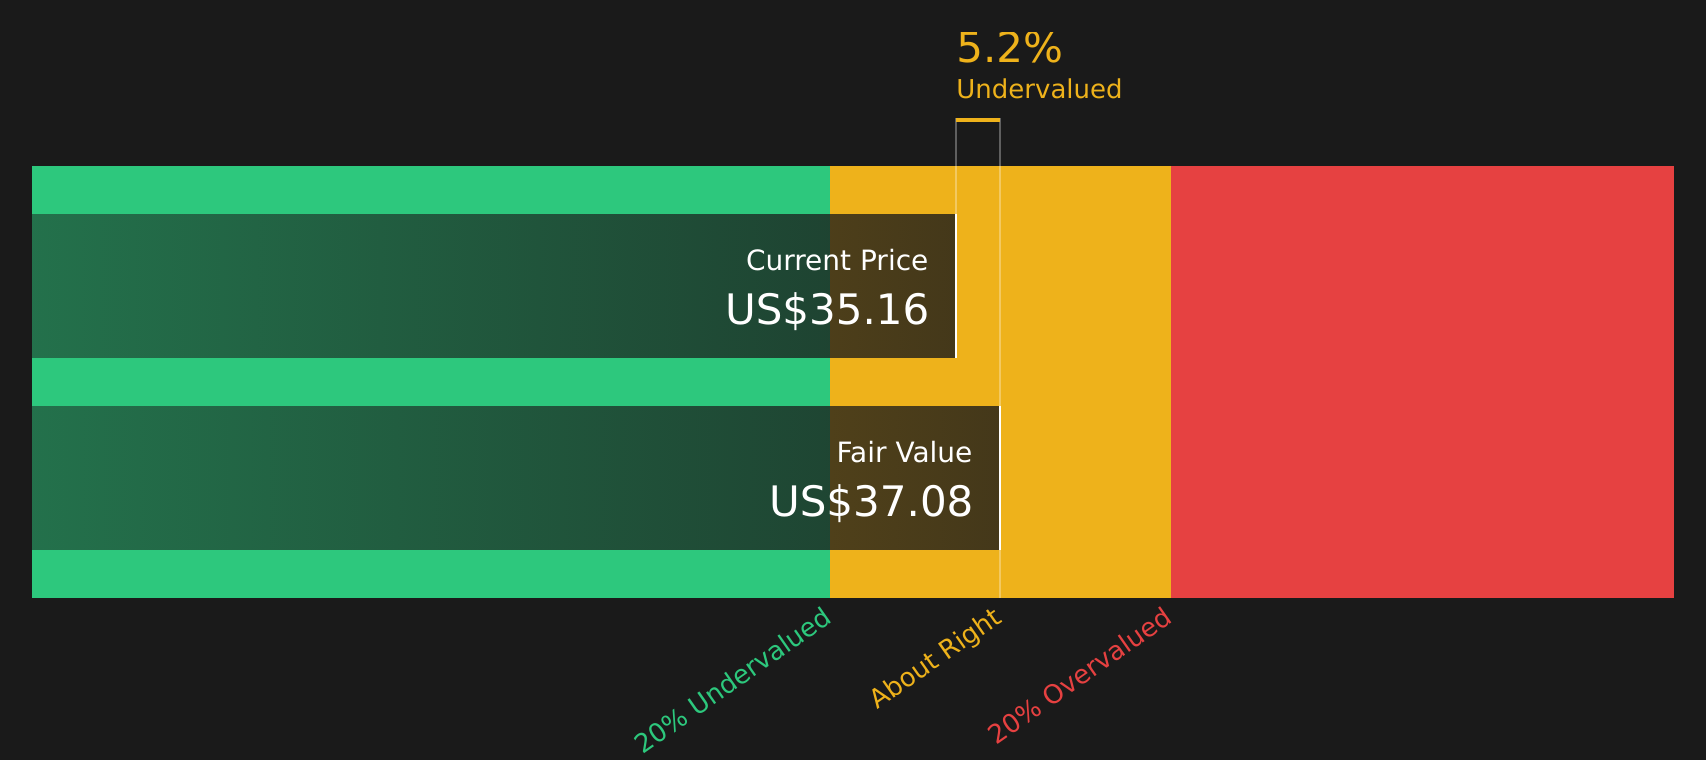
While the P/E of 10.7x makes AllianceBernstein Holding look roughly in line with some earnings based markers, the SWS DCF model presents a slightly different perspective. On this approach, AB at $35.78 sits about 3.2% below an estimated future cash flow value of $36.96, which raises the question of how much weight to place on cash flows compared with simple earnings multiples.
Simply Wall St performs a discounted cash flow (DCF) on every stock in the world every day (check out AllianceBernstein Holding for example). We show the entire calculation in full. You can track the result in your watchlist or portfolio and be alerted when this changes, or use our stock screener to discover 44 high quality undervalued stocks. If you save a screener we even alert you when new companies match - so you never miss a potential opportunity.
Next Steps
Cautious about the mixed signals around AllianceBernstein Holding but not ready to sit on the sidelines? Use the full data set, including the 2 key rewards and 4 important warning signs, to pressure test the balance of concerns and potential upsides for yourself.
Looking for more investment ideas beyond AllianceBernstein Holding?
Do not stop with AllianceBernstein Holding; broaden your opportunity set with focused stock ideas built from clear filters so you are not relying on one company alone.
- Target stability by reviewing companies that score well on resilience and risk with the 67 resilient stocks with low risk scores.
- Spot potential bargains by scanning for quality stocks that trade below estimated value using the 44 high quality undervalued stocks.
- Expand your watchlist with overlooked quality by checking the screener containing 19 high quality undiscovered gems.
This article by Simply Wall St is general in nature. We provide commentary based on historical data and analyst forecasts only using an unbiased methodology and our articles are not intended to be financial advice. It does not constitute a recommendation to buy or sell any stock, and does not take account of your objectives, or your financial situation. We aim to bring you long-term focused analysis driven by fundamental data. Note that our analysis may not factor in the latest price-sensitive company announcements or qualitative material. Simply Wall St has no position in any stocks mentioned.