Is Amazon (AMZN) Pricing Reflecting Its DCF And P/E Signals After Recent Flat Performance
Amazon.com, Inc. AMZN | 209.77 | -0.38% |
- If you are wondering whether Amazon.com is truly good value at today’s price, you are not alone. This article will walk through the key numbers that matter.
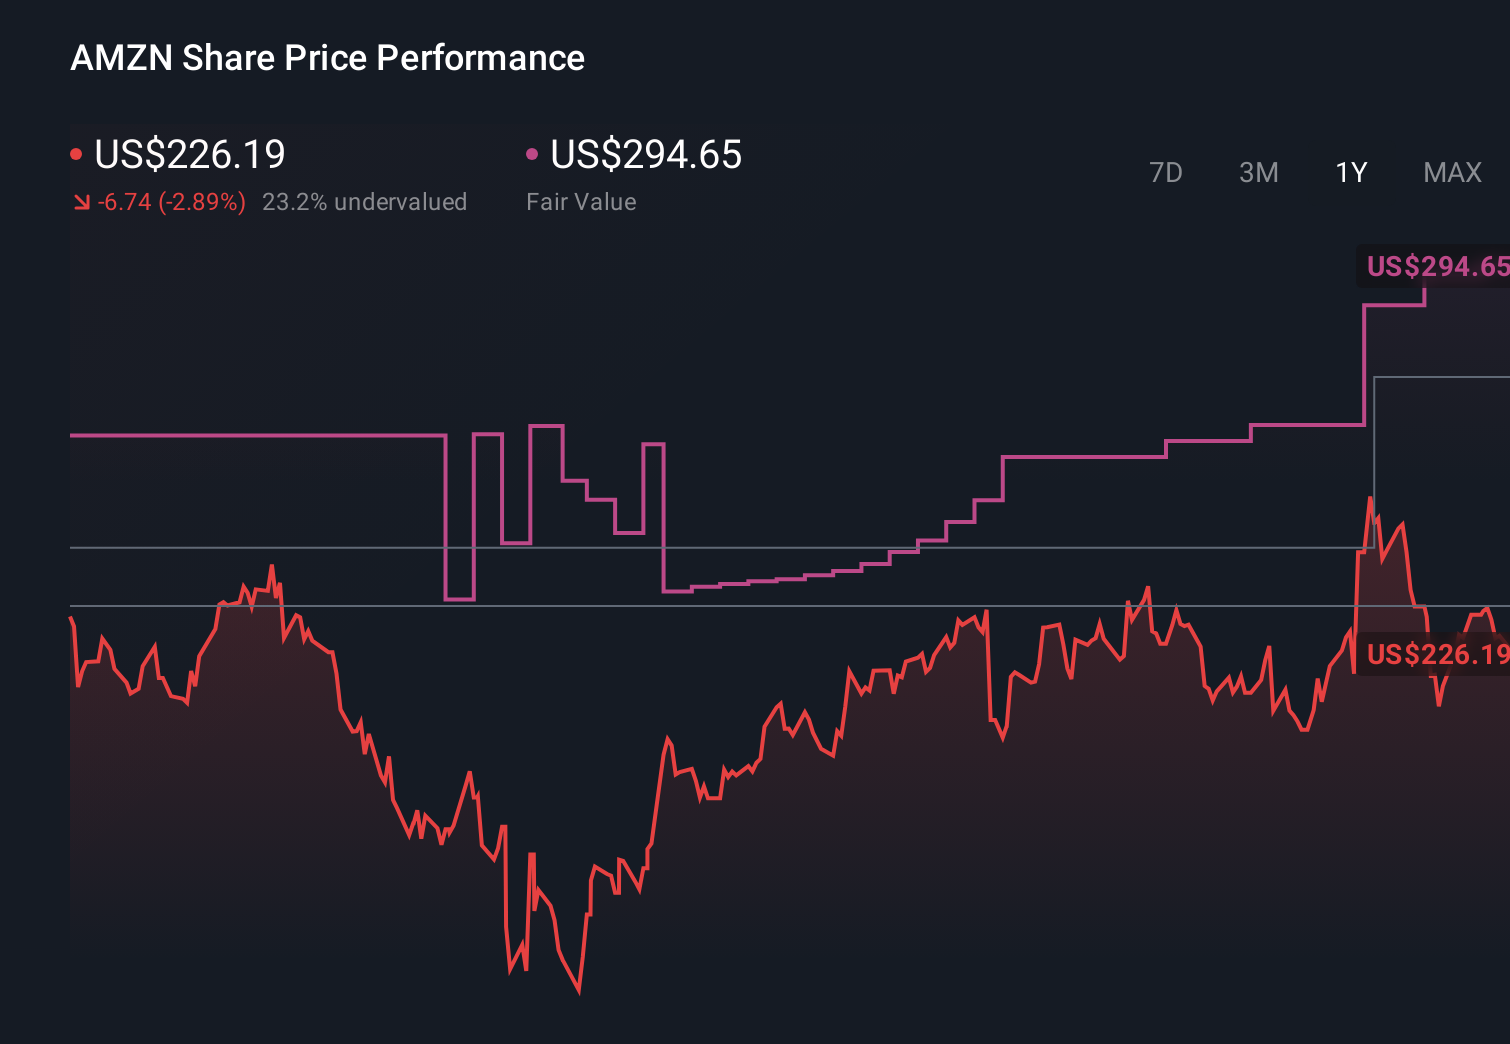
- With the share price at US$234.34, Amazon.com has seen a 1.6% decline over the last 7 days, a 0.9% gain over 30 days, a 3.5% gain year to date, and a 0.5% decline over the last year, while the 3 year and 5 year returns sit at 136.2% and 44.8% respectively.
- These returns sit against an ongoing flow of news around Amazon.com's core e commerce operations, its cloud business, and its push into new services. These factors continue to shape how investors think about its long term potential. Investors are weighing these developments alongside broader market sentiment toward large US technology related names when deciding what they are willing to pay for the stock.
- On our checks, Amazon.com scores 5 out of 6 on valuation, which you can see in more detail through our valuation score of 5. Next we will walk through the main valuation approaches behind that number before finishing with a different way to think about what the stock might be worth.
Approach 1: Amazon.com Discounted Cash Flow (DCF) Analysis
A Discounted Cash Flow model takes the cash Amazon.com is expected to generate in the future and discounts those projections back to what they are worth in today’s dollars.
In this approach, Amazon.com starts with last twelve month free cash flow of about $40.0b. Analyst estimates cover the next few years and Simply Wall St then extrapolates further, with projected free cash flow of $189.8b by 2030. All of these future cash flows are discounted back using a 2 Stage Free Cash Flow to Equity model.
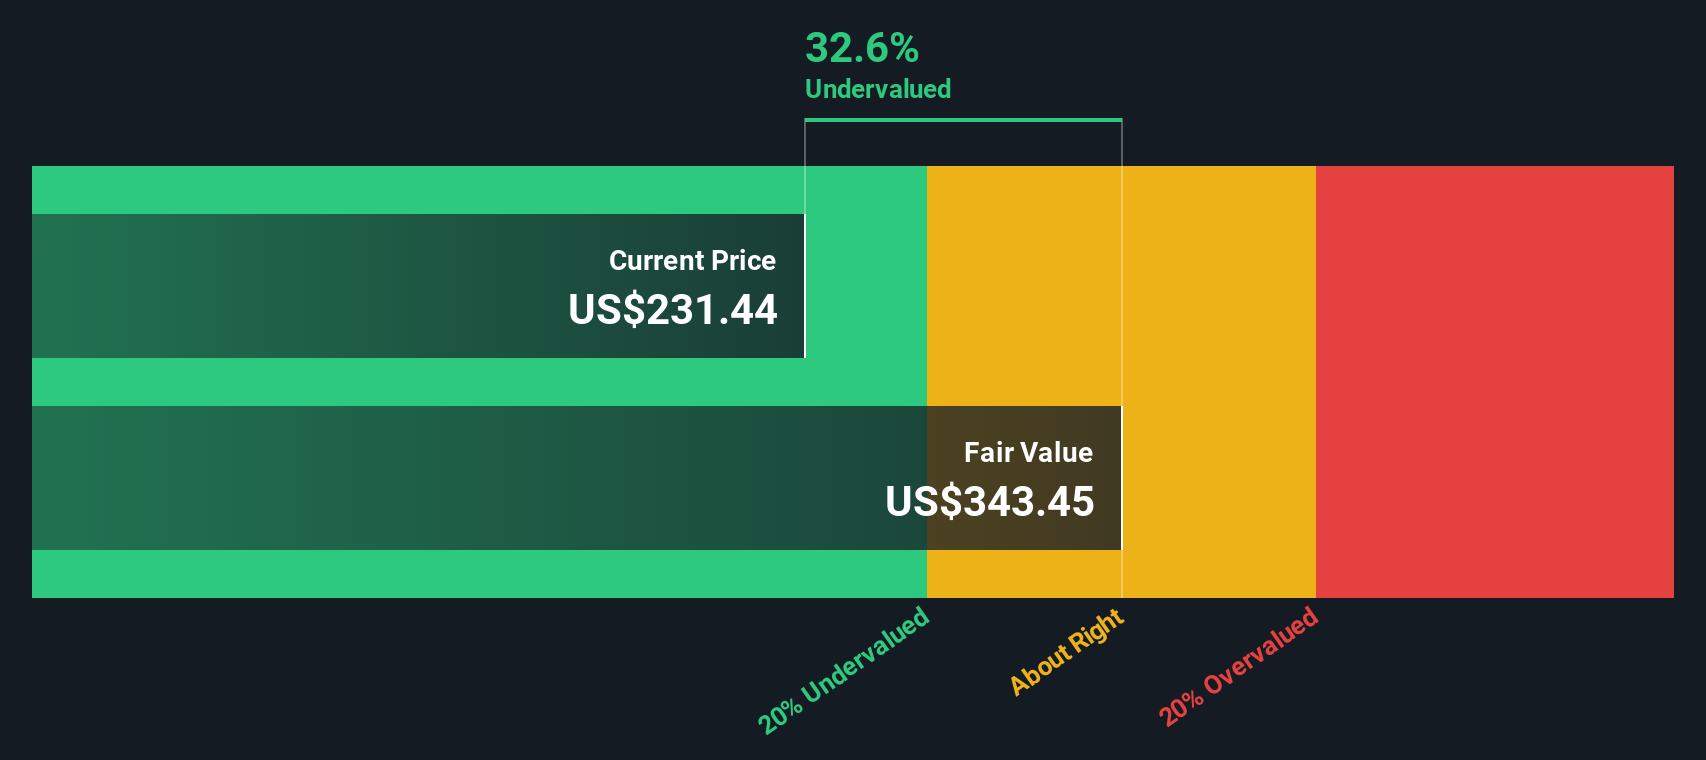
When these discounted cash flows are added together, the model arrives at an estimated intrinsic value of $377.08 per share. Compared with the current share price of $234.34, the DCF output implies a 37.9% discount to this estimate, which indicates the shares are trading below this modelled value based on the current assumptions.
Result: UNDERVALUED
Our Discounted Cash Flow (DCF) analysis suggests Amazon.com is undervalued by 37.9%. Track this in your watchlist or portfolio, or discover 880 more undervalued stocks based on cash flows.
Approach 2: Amazon.com Price vs Earnings
For a profitable company like Amazon.com, the P/E ratio is a useful shorthand for how much investors are paying for each dollar of current earnings. It ties the share price directly to earnings, which tend to be more stable than short term revenue swings or balance sheet values.
What counts as a normal or fair P/E often reflects how the market views a company’s growth prospects and risk. Higher expected growth and lower perceived risk usually support a higher P/E, while slower growth or higher risk often align with a lower P/E.
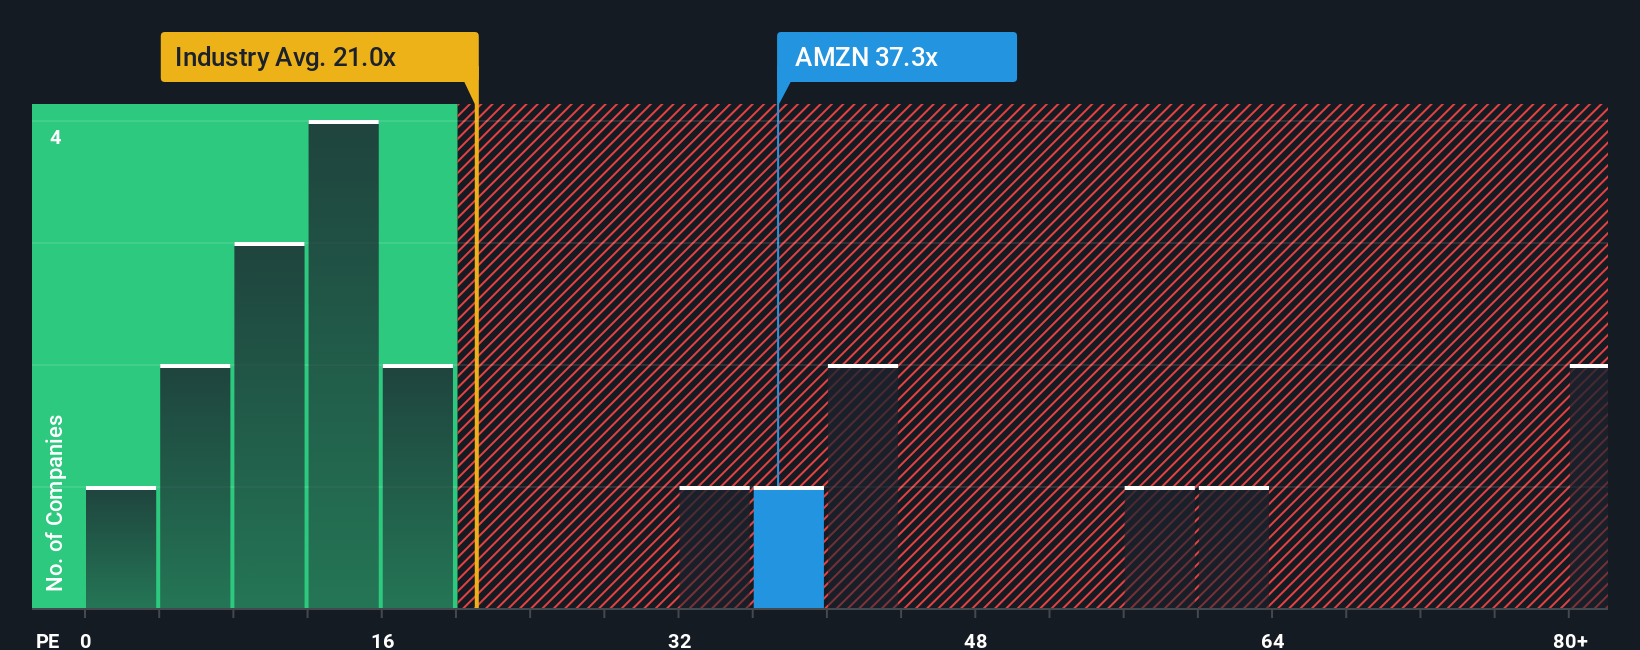
Amazon.com currently trades on a P/E of 32.75x, compared with a Multiline Retail industry average of 20.00x and a peer group average of 34.03x. Simply Wall St’s Fair Ratio framework estimates what P/E might make sense for Amazon.com at about 40.93x, based on factors like its earnings growth profile, industry, profit margins, market cap and specific risks.
This Fair Ratio is designed to go beyond simple peer or industry comparisons, because it adjusts for company specific characteristics rather than assuming that all retailers, or all large tech related names, should trade at similar multiples.
Since the Fair Ratio of 40.93x is higher than the current P/E of 32.75x, this approach points to the shares trading below that modelled level.
Result: UNDERVALUED
P/E ratios tell one story, but what if the real opportunity lies elsewhere? Discover 1427 companies where insiders are betting big on explosive growth.
Upgrade Your Decision Making: Choose your Amazon.com Narrative
Earlier we mentioned that there is an even better way to understand valuation, so let us introduce you to Narratives, which are simply your story about a company tied directly to your assumptions for fair value, future revenue, earnings and margins.
On Simply Wall St, Narratives sit inside the Community page and let you connect Amazon.com's business story, such as e commerce, cloud and new services, to a clear financial forecast and then to a fair value that you can compare with today’s share price.
When you create or follow a Narrative, you can see at a glance whether that story suggests Amazon.com looks cheap or expensive compared with its current price, which can help you decide if buying, holding, or selling may align with your approach.
Narratives also refresh automatically when new information like news or earnings is added, and for Amazon.com you might see one investor with a very optimistic Narrative and higher fair value, while another uses more cautious assumptions and arrives at a much lower fair value.
Do you think there's more to the story for Amazon.com? Head over to our Community to see what others are saying!
This article by Simply Wall St is general in nature. We provide commentary based on historical data and analyst forecasts only using an unbiased methodology and our articles are not intended to be financial advice. It does not constitute a recommendation to buy or sell any stock, and does not take account of your objectives, or your financial situation. We aim to bring you long-term focused analysis driven by fundamental data. Note that our analysis may not factor in the latest price-sensitive company announcements or qualitative material. Simply Wall St has no position in any stocks mentioned.