Is Amcor Set for a Rebound After Recent Share Price Drop in 2025?
AMCOR PLC AMCR | 39.58 | -2.75% |
If you are looking at Amcor lately and asking yourself whether it is time to jump in or get out, you are not alone. The packaging giant’s stock has had a rocky ride, dropping 3.1% in the last week and nearly 15% since the start of the year. That is on top of a one-year loss of 25.2%. At first glance, such a prolonged slide might make you wonder if the market is finally pricing in some of the industry’s headwinds or just giving Amcor extra room to breathe for long-term growth potential.
Behind these numbers, there has not been any single, headline-grabbing event. Instead, there has been a general shift in risk appetite for packaging and supply chain stocks as broader market concerns over global demand hang around. Some investors may see declining prices as a warning sign, but others find opportunity in the fallout, especially if the company’s underlying value is out of step with its stock price.
That is where things get interesting. By the numbers, Amcor currently scores a 2 on a standard value assessment, meaning it is undervalued in 2 out of 6 key checks. That might not sound dramatic, but it is a signal the market could be overlooking certain strengths, at least on some measures.
So, how does Amcor really stack up across the main valuation approaches analysts use? Let’s break down the different methods and hint at a more nuanced way of looking at the big picture before we wrap up.
Amcor scores just 2/6 on our valuation checks. See what other red flags we found in the full valuation breakdown.
Approach 1: Amcor Discounted Cash Flow (DCF) Analysis
A Discounted Cash Flow (DCF) model projects a company’s future cash flows and then discounts them back to today’s value, aiming to estimate what the business is worth right now. This approach helps investors look beyond short-term price movements and focus on the company’s ability to generate cash in the long run.
For Amcor, the latest reported Free Cash Flow (FCF) stands at $836.6 Million. Analysts forecast this figure will rise, with projected FCF reaching $1.086 Billion by fiscal 2029. The DCF model takes these analyst estimates up to five years and extends them further to produce a full ten-year cash flow outlook, ensuring longer-term valuation estimates. These projections are handled using a 2 Stage Free Cash Flow to Equity model, aligning near-term analyst estimates with more conservative, extrapolated trends for later years.
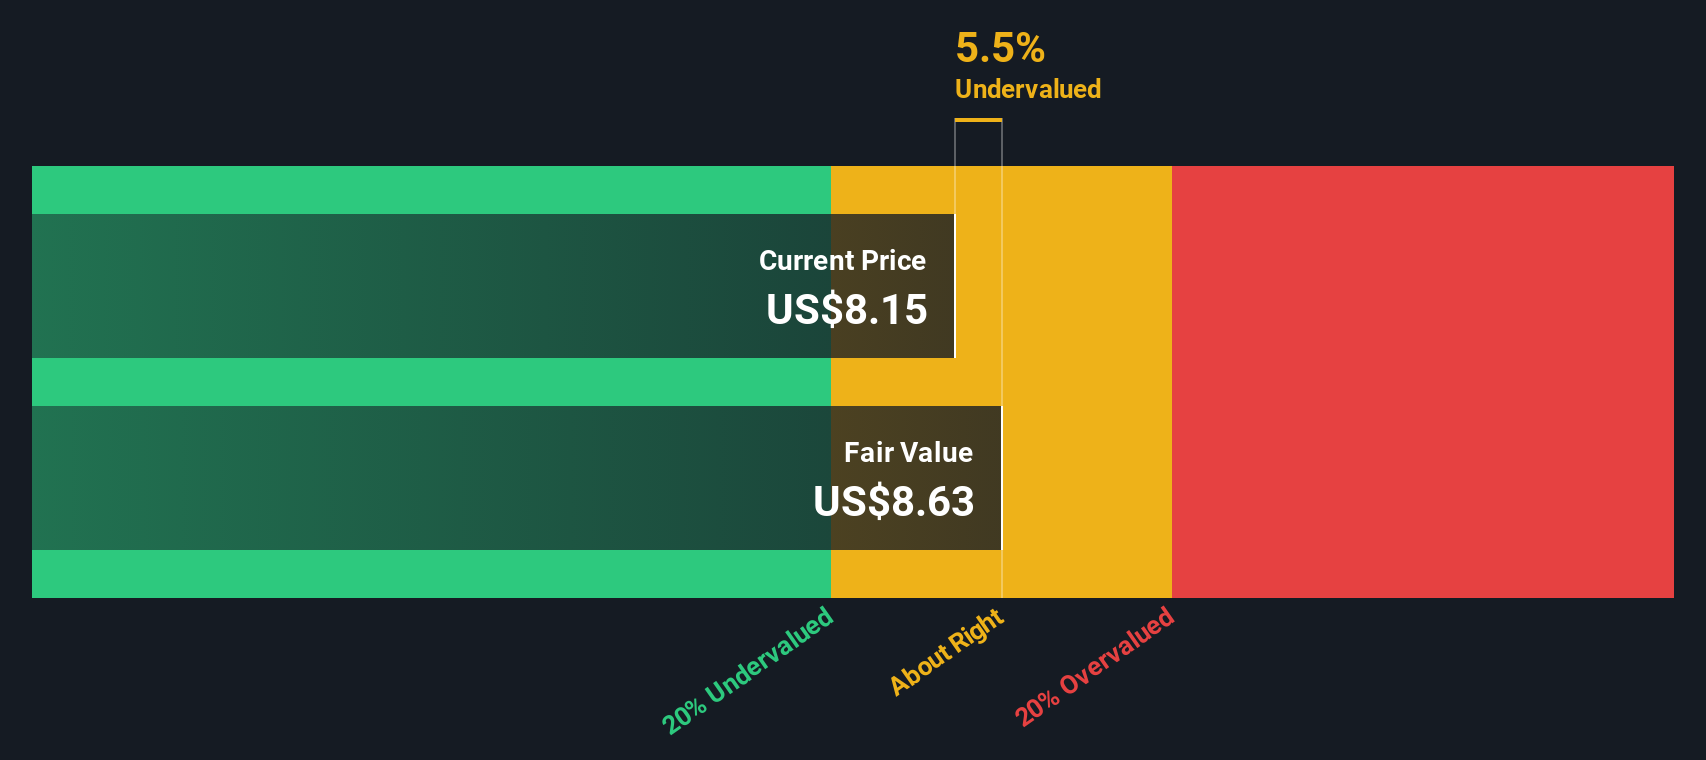
Based on these calculated future cash flows, the DCF analysis yields a fair value for Amcor of $8.53 per share. Compared to its current share price, this implies the stock is trading at a 7.0% discount. In other words, it is just about in line with its calculated intrinsic worth.
Result: ABOUT RIGHT
Simply Wall St performs a valuation analysis on every stock in the world every day (check out Amcor's valuation analysis). We show the entire calculation in full. You can track the result in your watchlist or portfolio and be alerted when this changes.
Approach 2: Amcor Price vs Earnings (P/E Ratio)
For profitable companies like Amcor, the Price-to-Earnings (P/E) ratio is one of the most widely used valuation metrics. It measures how much investors are willing to pay per dollar of earnings and can offer insight into whether a stock is seen as a bargain or expensive in relation to its profits.
What counts as a “normal” or “fair” P/E ratio depends on a range of factors. Faster growing companies and those with lower perceived risks tend to command higher P/E ratios, as investors are willing to pay up for growth and safety. Slower-growing or riskier firms usually trade at lower multiples.
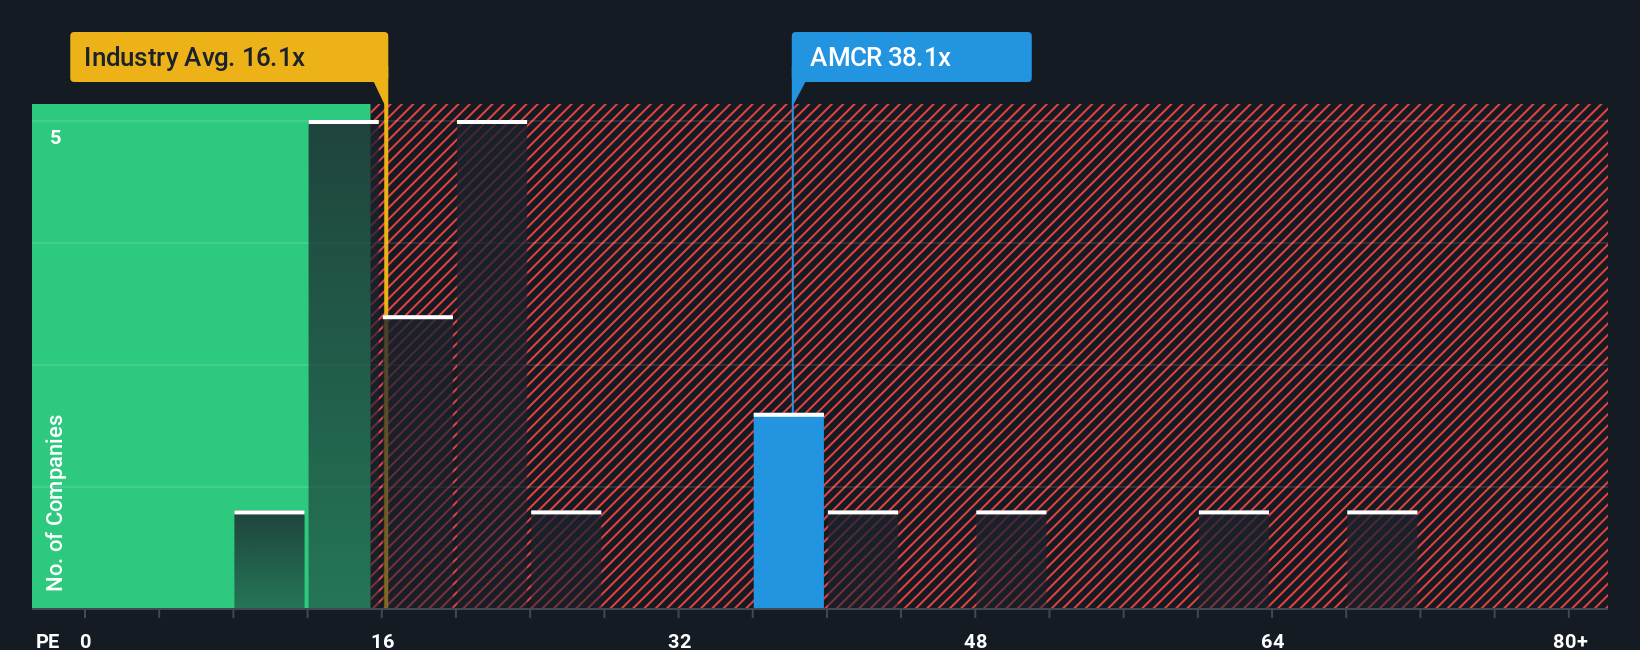
Amcor’s current P/E ratio stands at 35.9x. To put this in context, it is well above the Packaging industry average of 16.4x and also higher than the peer group average of 26.9x. However, raw comparisons only tell part of the story.
This is where Simply Wall St’s proprietary “Fair Ratio” comes in. The Fair Ratio looks beyond simple averages. It estimates the P/E that makes sense for Amcor specifically, based on factors like its expected earnings growth, profit margins, risk profile, industry characteristics, and overall market cap. In this case, the Fair Ratio for Amcor comes out to 25.5x, which is much more tailored than a one-size-fits-all industry snapshot.
Given that Amcor’s current P/E ratio of 35.9x is well above its Fair Ratio, the stock screens as overvalued using this yardstick. This suggests the market is pricing in higher expectations or not sufficiently accounting for the risks, relative to its actual financial profile.
Result: OVERVALUED
PE ratios tell one story, but what if the real opportunity lies elsewhere? Discover companies where insiders are betting big on explosive growth.
Upgrade Your Decision Making: Choose your Amcor Narrative
Earlier we mentioned that there is an even better way to understand valuation, so let’s introduce you to Narratives. A Narrative is a simple, accessible way for investors to put their own story behind the numbers, explaining why they think Amcor’s fair value and future performance might differ from market expectations. It connects what you believe about Amcor’s business, its future revenue, earnings, and profit margins to a financial forecast and ultimately a fair value per share.
On Simply Wall St’s Community page, millions of investors use Narratives to back up their outlooks and decisions. Narratives make it easier to decide whether it’s time to buy, hold, or sell by connecting your investment thesis directly to updated forecasts and comparing your own Fair Value to the current price. Importantly, Narratives update dynamically whenever key news, results, or fresh data are released, so your view can adapt as the story evolves.
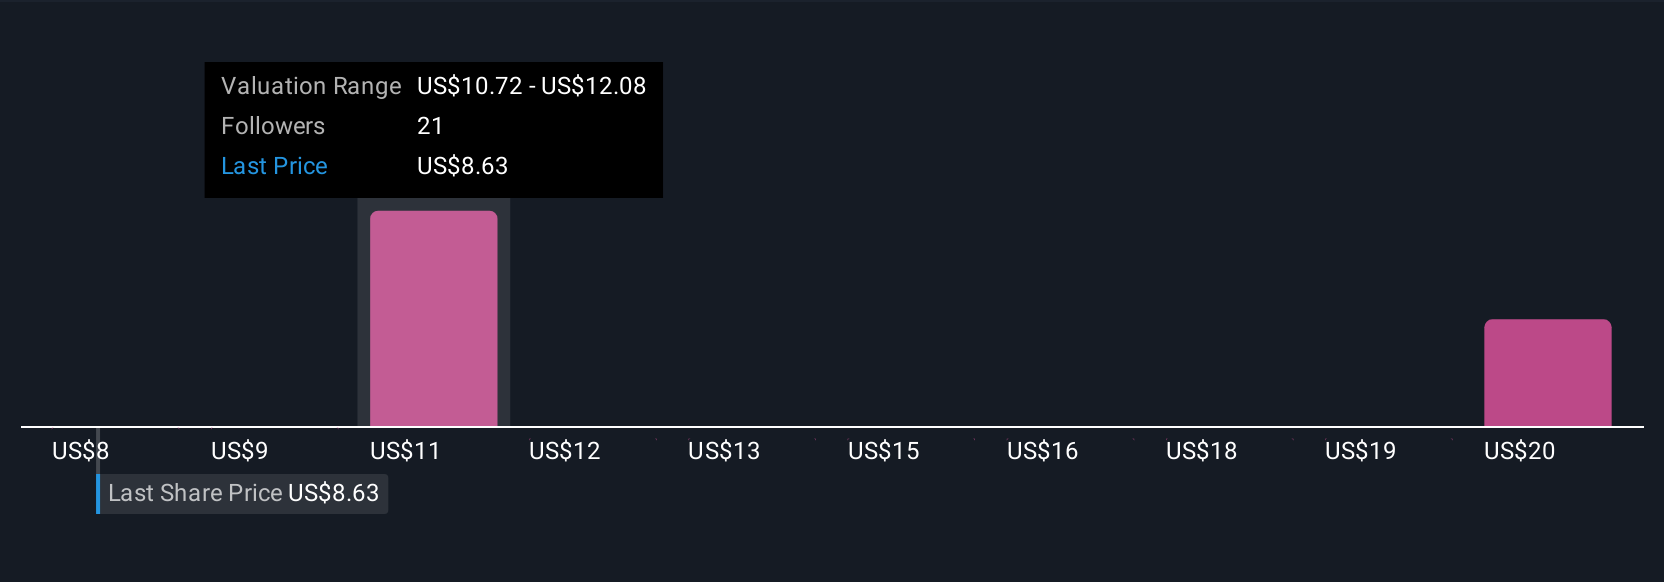
For example, some investors currently forecast Amcor’s fair value as high as $10.91 based on optimism around synergy gains and sustainable packaging growth, while others see it closer to $8.19 due to margin risks and persistent volume declines. Whichever side you lean towards, Narratives are designed to help make your investment decision more rational, transparent, and tailored to your outlook.
Do you think there's more to the story for Amcor? Create your own Narrative to let the Community know!
This article by Simply Wall St is general in nature. We provide commentary based on historical data and analyst forecasts only using an unbiased methodology and our articles are not intended to be financial advice. It does not constitute a recommendation to buy or sell any stock, and does not take account of your objectives, or your financial situation. We aim to bring you long-term focused analysis driven by fundamental data. Note that our analysis may not factor in the latest price-sensitive company announcements or qualitative material. Simply Wall St has no position in any stocks mentioned.