Is American Homes 4 Rent (AMH) Offering Value After Mixed Long Term Share Performance?
American Homes 4 Rent Class A AMH | 0.00 |
- Wondering whether American Homes 4 Rent is fairly priced or offering hidden value at current levels? This article walks through the key clues in the valuation data so you can judge for yourself.
- The stock recently closed at US$32.24, with returns of 0.5% over the past week, 0.8% over the past month, a 1.0% gain year to date, but a decline of 10.0% over the past year and 5.5% over five years.
- Recent coverage has focused on American Homes 4 Rent as part of broader conversations about listed single family rental landlords and how investors are treating residential property focused companies. This context helps frame why a relatively modest recent share price move can still sit alongside a weaker one year and five year return profile.
- On Simply Wall St’s framework the stock records a value score of 3 out of 6. This means half of the valuation checks point to potential undervaluation. The next step is to look at common valuation methods and then consider a different way to think about value that ties everything together.
Approach 1: American Homes 4 Rent Discounted Cash Flow (DCF) Analysis
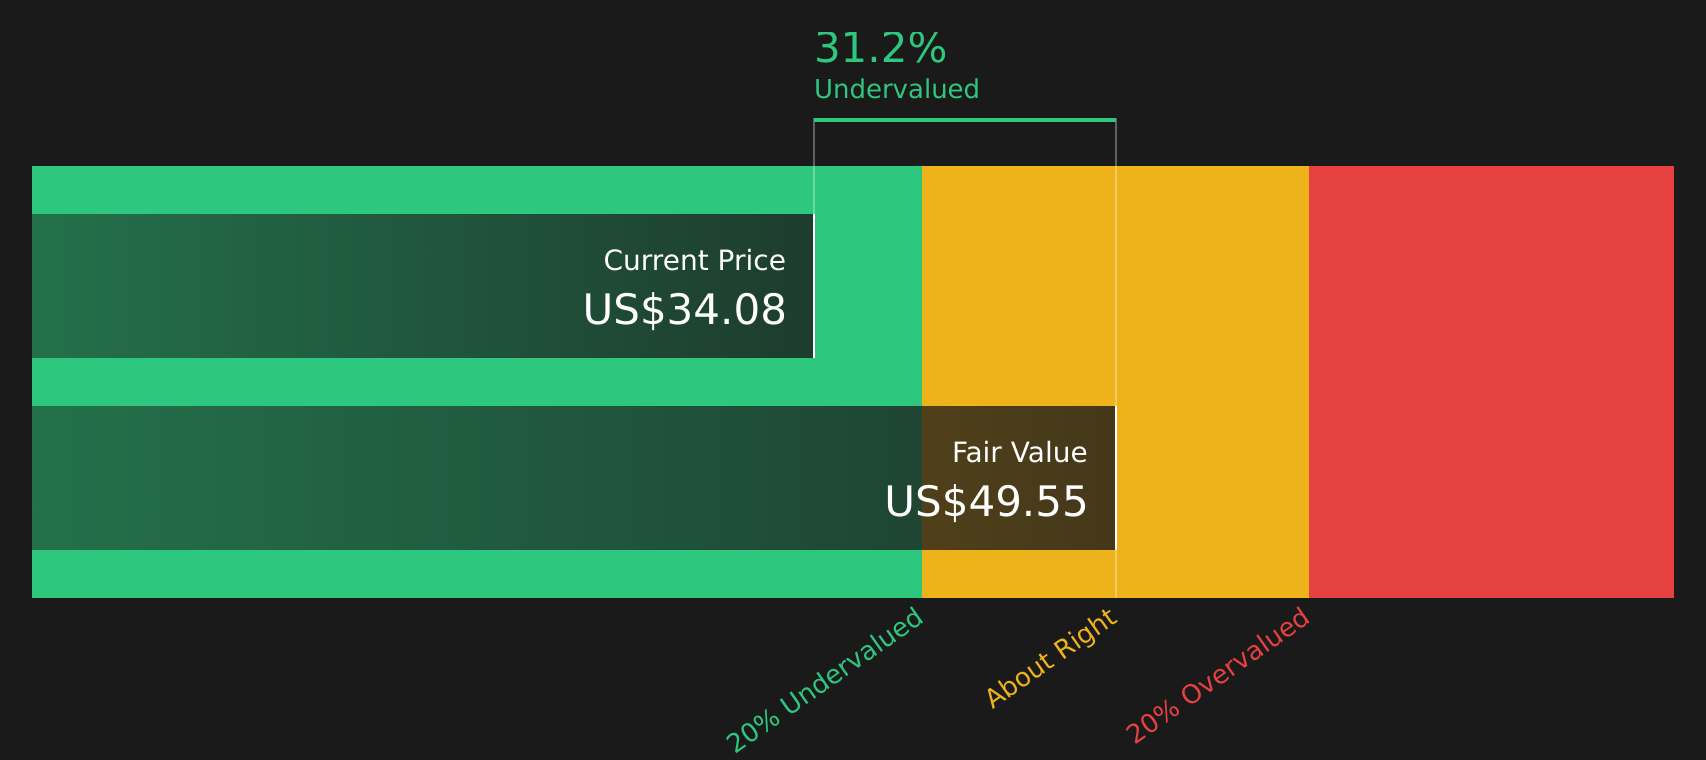
A Discounted Cash Flow model takes the cash the company is expected to generate in the future, in this case adjusted funds from operations to equity holders, and discounts those amounts back to what they are worth in $ today.
For American Homes 4 Rent, the latest twelve month free cash flow is reported at about $712.5 million. Analysts provide explicit estimates for the next few years, and Simply Wall St then extrapolates further, with projected free cash flow of about $1.0 billion in 2035 based on the two stage model.
Adding up these future cash flows and discounting them back using the 2 Stage Free Cash Flow to Equity model gives an estimated intrinsic value of about $47.51 per share. Compared with the recent share price of $32.24, this implies the stock trades at roughly a 32.1% discount to the model’s estimate, which indicates potential undervaluation using this method.
Result: UNDERVALUED
Our Discounted Cash Flow (DCF) analysis suggests American Homes 4 Rent is undervalued by 32.1%. Track this in your watchlist or portfolio, or discover 47 more high quality undervalued stocks.
Approach 2: American Homes 4 Rent Price vs Earnings
For a profitable company like American Homes 4 Rent, the P/E ratio is a useful way to think about what you are paying for each dollar of earnings. Higher growth expectations and lower perceived risk can justify a higher “normal” P/E, while slower growth or higher risk usually point to a lower one.
American Homes 4 Rent currently trades on a P/E of 25.52x. That sits close to the Residential REITs industry average P/E of 24.19x and well below the wider peer group average of 57.32x. Simply Wall St also provides a Fair Ratio of 22.81x, which reflects the P/E that might be expected given factors such as the company’s earnings growth profile, profit margins, industry, market cap and risk characteristics.
This Fair Ratio is more tailored than a simple comparison with peers or the industry because it attempts to adjust for company specific traits rather than relying on broad group averages. Comparing 25.52x with the Fair Ratio of 22.81x suggests the stock trades somewhat above this customised benchmark, which points to it being overvalued on this measure.
Result: OVERVALUED

P/E ratios tell one story, but what if the real opportunity lies elsewhere? Start investing in legacies, not executives. Discover our 20 top founder-led companies.
Upgrade Your Decision Making: Choose your American Homes 4 Rent Narrative
Earlier it was mentioned that there is an even better way to understand valuation. Narratives on Simply Wall St's Community page let you attach your own story about American Homes 4 Rent, such as whether you focus more on risks like higher development costs and shifting renter demand or on supports like strong retention and access to capital. You can then link that story to specific revenue, earnings and margin assumptions that feed into a Fair Value which is compared with the current share price and updated automatically as new news and earnings arrive. This way, you can see why one investor might build a cautious Narrative closer to the US$29 analyst target, while another builds a more optimistic one nearer US$40, and use those differing fair values as a guide for when the stock looks closer to fully priced or offers more valuation support.
Do you think there's more to the story for American Homes 4 Rent? Head over to our Community to see what others are saying!

This article by Simply Wall St is general in nature. We provide commentary based on historical data and analyst forecasts only using an unbiased methodology and our articles are not intended to be financial advice. It does not constitute a recommendation to buy or sell any stock, and does not take account of your objectives, or your financial situation. We aim to bring you long-term focused analysis driven by fundamental data. Note that our analysis may not factor in the latest price-sensitive company announcements or qualitative material. Simply Wall St has no position in any stocks mentioned.