Is American Tower (AMT) Pricing Reflecting Its Recent Share Performance And Growth Outlook?
American Tower Corporation AMT | 0.00 |
- If you are wondering whether American Tower at around US$187.53 is offering value or just adding noise to your portfolio, this article breaks down what the current price might really imply.
- The stock has recently returned 2.0% over 7 days and 3.3% over 30 days, with a year-to-date return of 7.3% but a decline of 9.2% over the past year and 18.8% over 5 years.
- Recent coverage has focused on American Tower within the wider real estate investment trust universe, with commentators paying close attention to how interest rate expectations and capital allocation trends affect large tower owners. There has also been ongoing discussion about how data usage, 5G rollouts and carrier investment priorities could influence sentiment toward tower stocks like American Tower.
- On Simply Wall St's six-point valuation checklist, American Tower currently scores 5 out of 6. The rest of this article walks through the main valuation methods behind that score before finishing with one more way to look at value that many investors overlook.
Approach 1: American Tower Discounted Cash Flow (DCF) Analysis
A DCF model looks at the cash American Tower is expected to generate in the future, then discounts those cash flows back to today to estimate what the stock could be worth now. Here the model uses adjusted funds from operations as a proxy for free cash flow to equity.
American Tower currently has last twelve month free cash flow of about $5.0b. Analyst and extrapolated estimates used by Simply Wall St project free cash flow reaching about $6.6b by 2030, with a detailed path of annual forecasts and extrapolated figures out to 2035 included in the model.
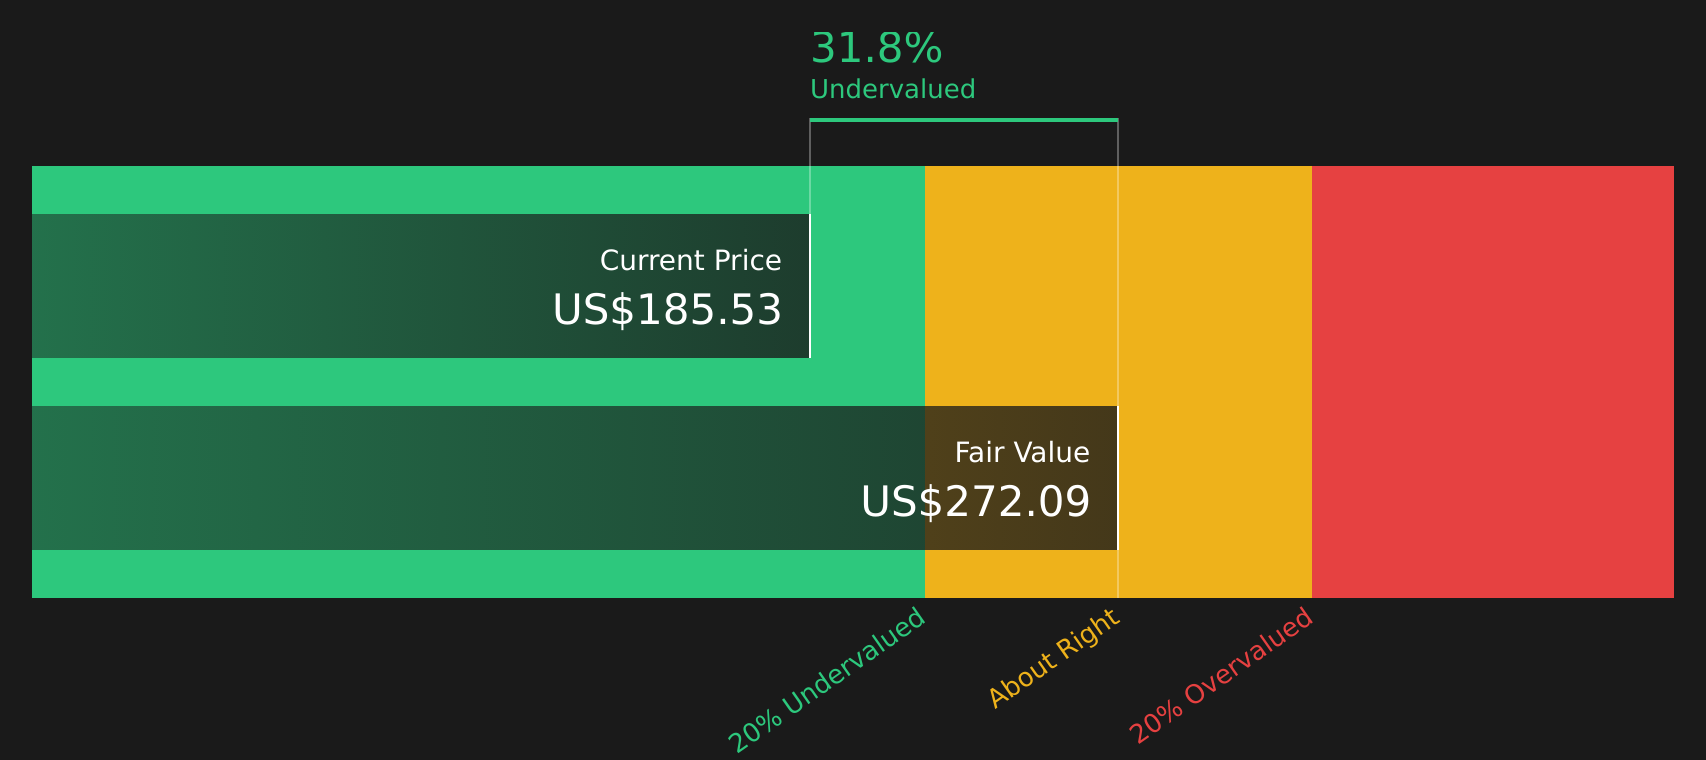
Discounting those projected cash flows back to today using the 2 Stage Free Cash Flow to Equity model gives an estimated intrinsic value of $271.04 per share. At a current share price of around $187.53, the model output indicates the stock trades at a 30.8% discount. On this DCF view, that suggests the stock may be undervalued.
Result: UNDERVALUED
Our Discounted Cash Flow (DCF) analysis suggests American Tower is undervalued by 30.8%. Track this in your watchlist or portfolio, or discover 47 more high quality undervalued stocks.
Approach 2: American Tower Price vs Earnings
For a profitable company like American Tower, the P/E ratio is a useful way to relate what you pay for the stock to the earnings it currently generates. It lets you see how many dollars investors are paying today for each dollar of earnings.
What counts as a "normal" or "fair" P/E depends on how fast earnings are expected to grow and how risky those earnings are. Higher expected growth or lower perceived risk can justify a higher P/E, while slower growth or higher risk usually points to a lower P/E.
American Tower currently trades on a P/E of about 30.1x. That is higher than the Specialized REITs industry average P/E of roughly 15.9x, but below the peer group average of about 45.2x. Simply Wall St also calculates a proprietary "Fair Ratio" of 33.8x for American Tower, which reflects factors such as earnings growth expectations, profit margins, industry, market cap and company specific risks.
This Fair Ratio can be more informative than a simple comparison with peers or industry averages because it adjusts for the quality and growth profile of the business rather than assuming all companies deserve the same multiple. Comparing the current P/E of 30.1x with the Fair Ratio of 33.8x suggests the stock may be trading at a discount to that implied level.
Result: UNDERVALUED

P/E ratios tell one story, but what if the real opportunity lies elsewhere? Start investing in legacies, not executives. Discover our 20 top founder-led companies.
Upgrade Your Decision Making: Choose your American Tower Narrative
Earlier it was mentioned that there is an even better way to think about valuation, so Narratives are a simple way to connect your view of American Tower’s story to a forecast and a fair value number you can actually use. A Narrative lets you set assumptions for future revenue, earnings and margins, then links those to a fair value that can be compared with the current share price to help you decide whether the stock looks attractive or stretched. On Simply Wall St, Narratives sit inside the Community page, where millions of investors share different story and number combinations in an easy, accessible format. As new information such as earnings reports or major news is released, these Narratives update so your fair value view can stay aligned with the latest data. For American Tower, some investors might build a Narrative that focuses on global data growth and see a higher fair value, while others might focus on funding costs and assign a much lower fair value. This shows how the same stock can support very different yet structured viewpoints.
Do you think there's more to the story for American Tower? Head over to our Community to see what others are saying!

This article by Simply Wall St is general in nature. We provide commentary based on historical data and analyst forecasts only using an unbiased methodology and our articles are not intended to be financial advice. It does not constitute a recommendation to buy or sell any stock, and does not take account of your objectives, or your financial situation. We aim to bring you long-term focused analysis driven by fundamental data. Note that our analysis may not factor in the latest price-sensitive company announcements or qualitative material. Simply Wall St has no position in any stocks mentioned.