

Is Anterix (ATEX) Expensive Following Its Sharp Share Price Surge?
Anterix Inc. ATEX | 0.00 |
Anterix (ATEX) has recently drawn investor attention after a strong share price move over the past month, prompting fresh questions about how its licensed 900 MHz spectrum business and financial profile compare with current expectations.
At a latest share price of $103.99, Anterix has seen strong momentum build over the past year, with a 30 day share price return of 35.02% and a year to date share price return of 367.79%, alongside a 1 year total shareholder return of 364.86% that reflects both price moves and any reinvested value for investors.
If Anterix’s surge has you reassessing opportunities in critical infrastructure and communications, this can be a useful moment to look at other power grid technology ideas via the 36 power grid technology and infrastructure stocks
After such a sharp move and with the share price now close to the average analyst target, the question for Anterix is whether most of the easy upside is already behind the stock or if valuation still points to more ahead.
Price-to-Earnings of 22.4x: Is it justified?
With Anterix trading at $103.99, the current P/E of 22.4x sits well above several reference points. This suggests investors are already pricing in a premium for the stock compared with both peers and an internally assessed fair level.
The P/E ratio compares the current share price with earnings per share and is a common way to see how much investors are paying for each dollar of profit. For Anterix, the current 22.4x P/E is described as expensive versus the estimated fair P/E of 4.9x. This implies the market price is far ahead of that fair ratio level.
In addition, the same P/E of 22.4x is also described as expensive compared with the Global Telecom industry average of 17.3x and a peer group average of 19.9x. This points to Anterix carrying a richer valuation than both its sector and closer comparables, and if the market were to move closer to the fair P/E ratio cited, that premium could narrow meaningfully.
Result: Price-to-Earnings of 22.4x (OVERVALUED)
However, investors still need to weigh risks, including Anterix’s sharp recent share price gains and annual net income growth, which is described as declining 72.68%.
Another View on Anterix: Cash Flows Point to a Different Story
While Anterix looks expensive on a 22.4x P/E, the SWS DCF model goes further by estimating the present value of future cash flows at $53.19 per share, well below the current $103.99 price. That gap suggests limited margin for error. What is the market really paying up for?
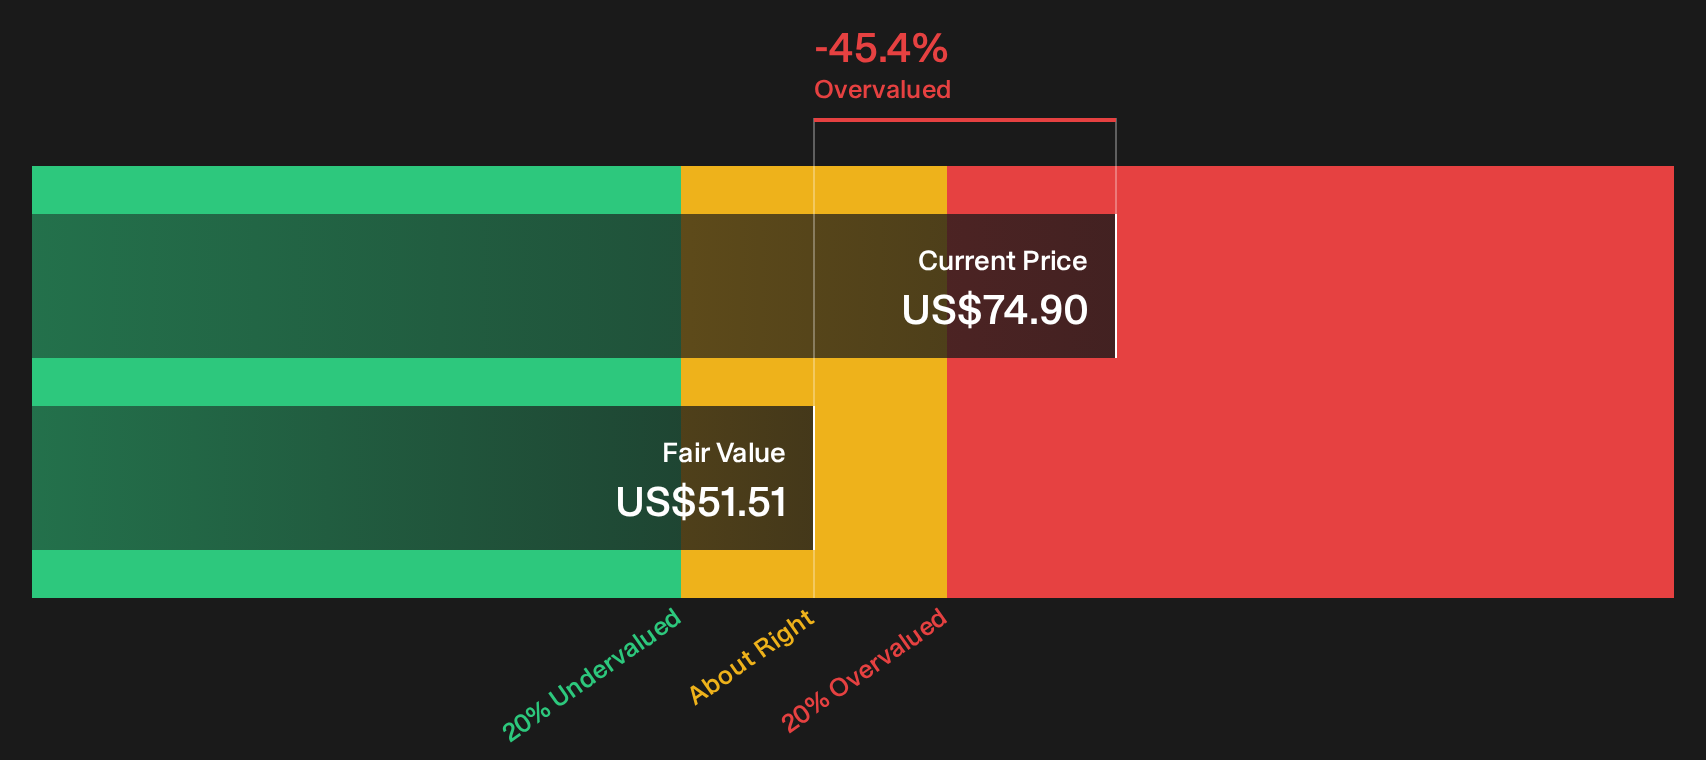
Simply Wall St performs a discounted cash flow (DCF) on every stock in the world every day (check out Anterix for example). We show the entire calculation in full. You can track the result in your watchlist or portfolio and be alerted when this changes, or use our stock screener to discover 47 high quality undervalued stocks. If you save a screener we even alert you when new companies match - so you never miss a potential opportunity.
Next Steps
If the mixed picture around Anterix’s valuation, risks and potential rewards feels hard to balance, use the full data to reach your own judgment quickly and review the 2 key rewards and 4 important warning signs.
Looking for more investment ideas beyond Anterix?
If Anterix has sharpened your focus on where to put your next dollar, do not stop here. Widen your lens and compare it with other clear stock ideas.
- Spot potential bargains quickly by scanning companies that screen well on value and quality through the 47 high quality undervalued stocks.
- Prioritise resilience by checking stocks that pair lower risk profiles with sturdier fundamentals using the 82 resilient stocks with low risk scores.
- Get ahead of the crowd by searching a screener containing 20 high quality undiscovered gems that could sit off most radars but still show strong underlying numbers.
This article by Simply Wall St is general in nature. We provide commentary based on historical data and analyst forecasts only using an unbiased methodology and our articles are not intended to be financial advice. It does not constitute a recommendation to buy or sell any stock, and does not take account of your objectives, or your financial situation. We aim to bring you long-term focused analysis driven by fundamental data. Note that our analysis may not factor in the latest price-sensitive company announcements or qualitative material. Simply Wall St has no position in any stocks mentioned.