

Is Apollo Global Management (APO) Above Fair Value As Russell Index Removals Pressure Sentiment?
Apollo Global Management Inc APO | 0.00 |
Index removals put Apollo Global Management under the spotlight
Apollo Global Management (APO) recently dropped out of several Russell growth benchmarks, an event that often triggers mechanical selling by index funds and can influence short term trading flows in the stock.
This shift in index status comes alongside recent pressure on Apollo Global Management shares, which have seen a 7 day losing streak and a reduction in market capitalization. This has prompted investors to reassess how they view the stock’s risk and valuation profile.
Against that backdrop, Apollo Global Management’s share price has had a mixed run. A 10.81% 90 day share price gain contrasts with a year to date share price decline of 19.10%, while the 5 year total shareholder return of 114.55% points to a stronger longer term record even as recent momentum has faded.
If this index reshuffle has you rethinking your exposure, it can be useful to broaden your search and see what other established businesses look like across markets, starting with 20 top founder-led companies
With Apollo Global Management now trading below some third party value estimates and sitting at a discount to analyst price targets, investors face a key question: is there mispricing here, or is the market already factoring in future growth?
Preferred Price-to-Earnings of 59.2x: Is it justified for Apollo Global Management?
On traditional metrics, Apollo Global Management does not look cheap. The stock trades on a P/E of 59.2x, while the SWS fair P/E estimate for Apollo sits at 26.4x and the wider US Diversified Financial industry averages 15.7x. That gap is hard to ignore if you are using earnings as your primary anchor.
The P/E ratio compares a company’s share price to its earnings per share, so a higher multiple usually means investors are willing to pay more today for each dollar of current earnings. For a business like Apollo Global Management, which earns fees on assets under management and also reports investment income, the P/E can reflect expectations around future fee growth, performance income and capital deployment across private equity, credit and retirement services.
In Apollo Global Management’s case, several signals pull in different directions. On one hand, earnings are forecast to grow 32.44% per year and are expected to outpace the broader US market, which sits at 18.6% per year. Earnings have also grown 27.7% per year over the past 5 years, and analysts are in tight agreement with a target price that is 27.5% above the current share price. On the other hand, profit margins have declined from 15.1% to 3.7%, return on equity is currently 7.7% and forecast to remain below the 20% high return threshold, revenue growth has been weak, and the dividend is not well covered by earnings.
Compared with peers, the premium is even more stark. Apollo Global Management’s 59.2x P/E is higher than the US Diversified Financial industry average of 15.7x and above the peer average of 33.9x. The SWS fair P/E ratio of 26.4x suggests a level the market could move toward if expectations around growth, profitability and risk were to compress closer to sector norms.
Result: Price-to-Earnings of 59.2x (OVERVALUED)
However, earnings pressure from fee compression or weaker performance at Apollo Global Management’s retirement services arm could quickly challenge today’s premium P/E and optimistic forecasts.
Another view on Apollo Global Management’s valuation
While the P/E work suggests Apollo Global Management looks expensive, the SWS DCF model points to a different angle. On this measure, APO is trading above an estimated future cash flow value of $104.47, which also implies a premium. If both earnings and cash flow point to rich pricing, what could shift that picture?
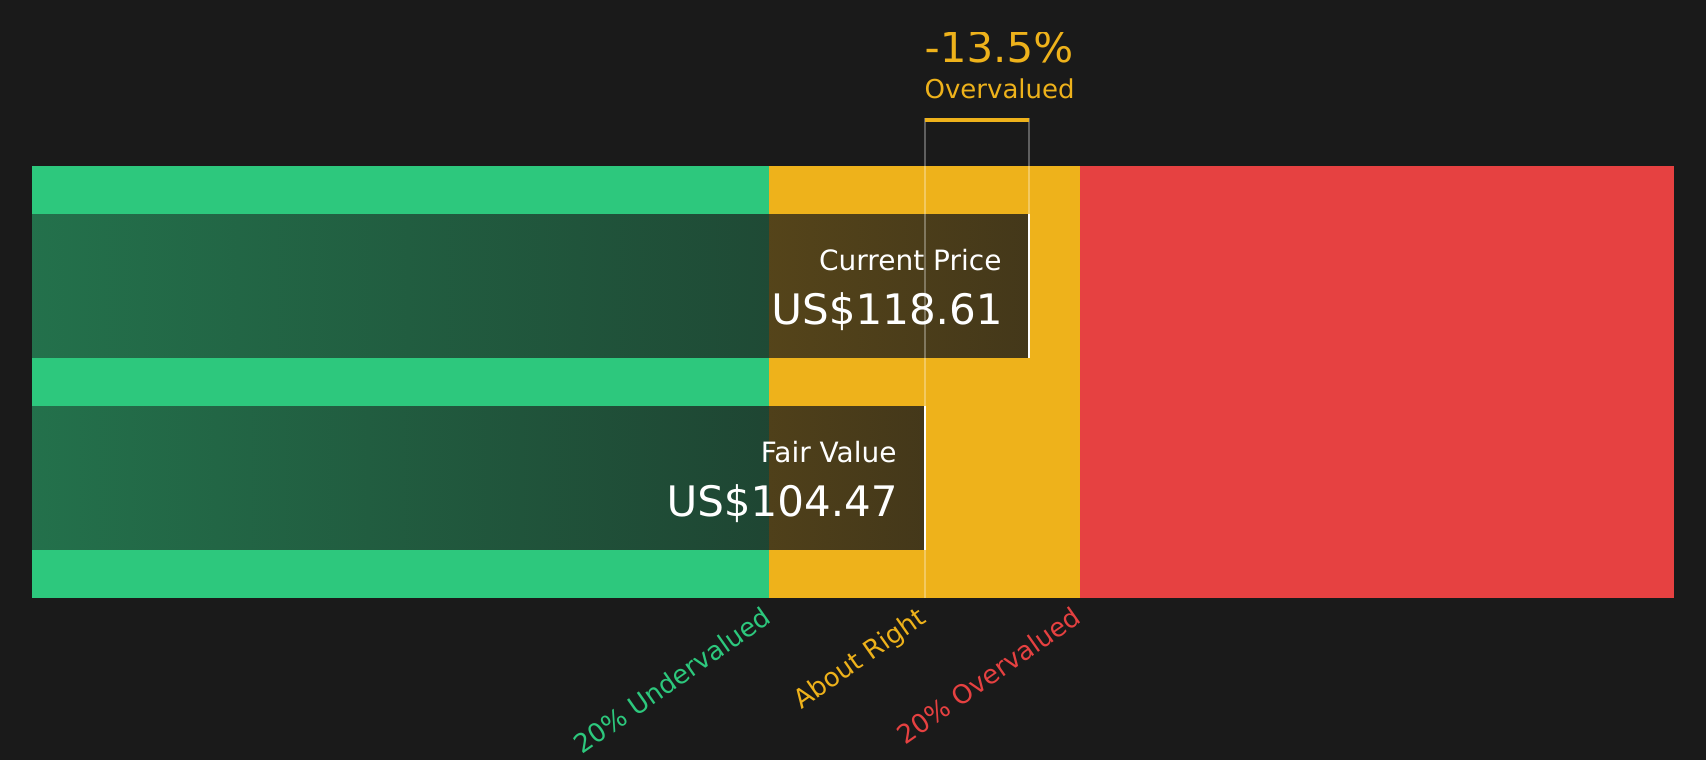
Simply Wall St performs a discounted cash flow (DCF) on every stock in the world every day (check out Apollo Global Management for example). We show the entire calculation in full. You can track the result in your watchlist or portfolio and be alerted when this changes, or use our stock screener to discover 44 high quality undervalued stocks. If you save a screener we even alert you when new companies match - so you never miss a potential opportunity.
Next Steps
With both risks and rewards in play for Apollo Global Management, the question is how you interpret the balance and what matters most for your portfolio. Take a closer look at the underlying data, move quickly to form your own stance, and weigh up the 2 key rewards and 3 important warning signs.
Looking for more investment ideas beyond Apollo Global Management?
If Apollo Global Management has sharpened your thinking, do not stop here. Use the Simply Wall St Screener to quickly spot fresh, data backed opportunities that fit your style.
- Target resilient income by reviewing companies offering reliable yields and payout strength with the support of the 7 dividend fortresses.
- Zero in on quality for less by using the 44 high quality undervalued stocks to find stocks where fundamentals and valuation may be out of sync.
- Strengthen your core holdings by searching for companies with robust finances through the solid balance sheet and fundamentals stocks screener (47 results).
This article by Simply Wall St is general in nature. We provide commentary based on historical data and analyst forecasts only using an unbiased methodology and our articles are not intended to be financial advice. It does not constitute a recommendation to buy or sell any stock, and does not take account of your objectives, or your financial situation. We aim to bring you long-term focused analysis driven by fundamental data. Note that our analysis may not factor in the latest price-sensitive company announcements or qualitative material. Simply Wall St has no position in any stocks mentioned.