Is Apollo Global Management (APO) Pricing Reflect Its Strong Multi Year Share Price Performance
Apollo Global Management Inc APO | 0.00 |
- If you are wondering whether Apollo Global Management's current share price lines up with its underlying worth, this article walks through the key numbers in plain language.
- The stock last closed at US$127.79, with a 21.3% gain over the past 30 days, a 0.7% decline over 7 days, a 12.8% decline year to date and a 2.6% decline over the past year. This is set against a 110.8% return over 3 years and a 152.8% return over 5 years.
- Recent attention on Apollo Global Management has focused on how its long term return profile compares with shorter term pullbacks. This has put valuation back in the spotlight for many investors. This context makes it useful to separate the share price moves from what various valuation methods say about the business today.
- On Simply Wall St's 6 point valuation checklist, Apollo Global Management scores 2 out of 6. The next sections will walk through what that means across different valuation approaches, before finishing with a broader way to think about valuation that pulls everything together.
Apollo Global Management scores just 2/6 on our valuation checks. See what other red flags we found in the full valuation breakdown.
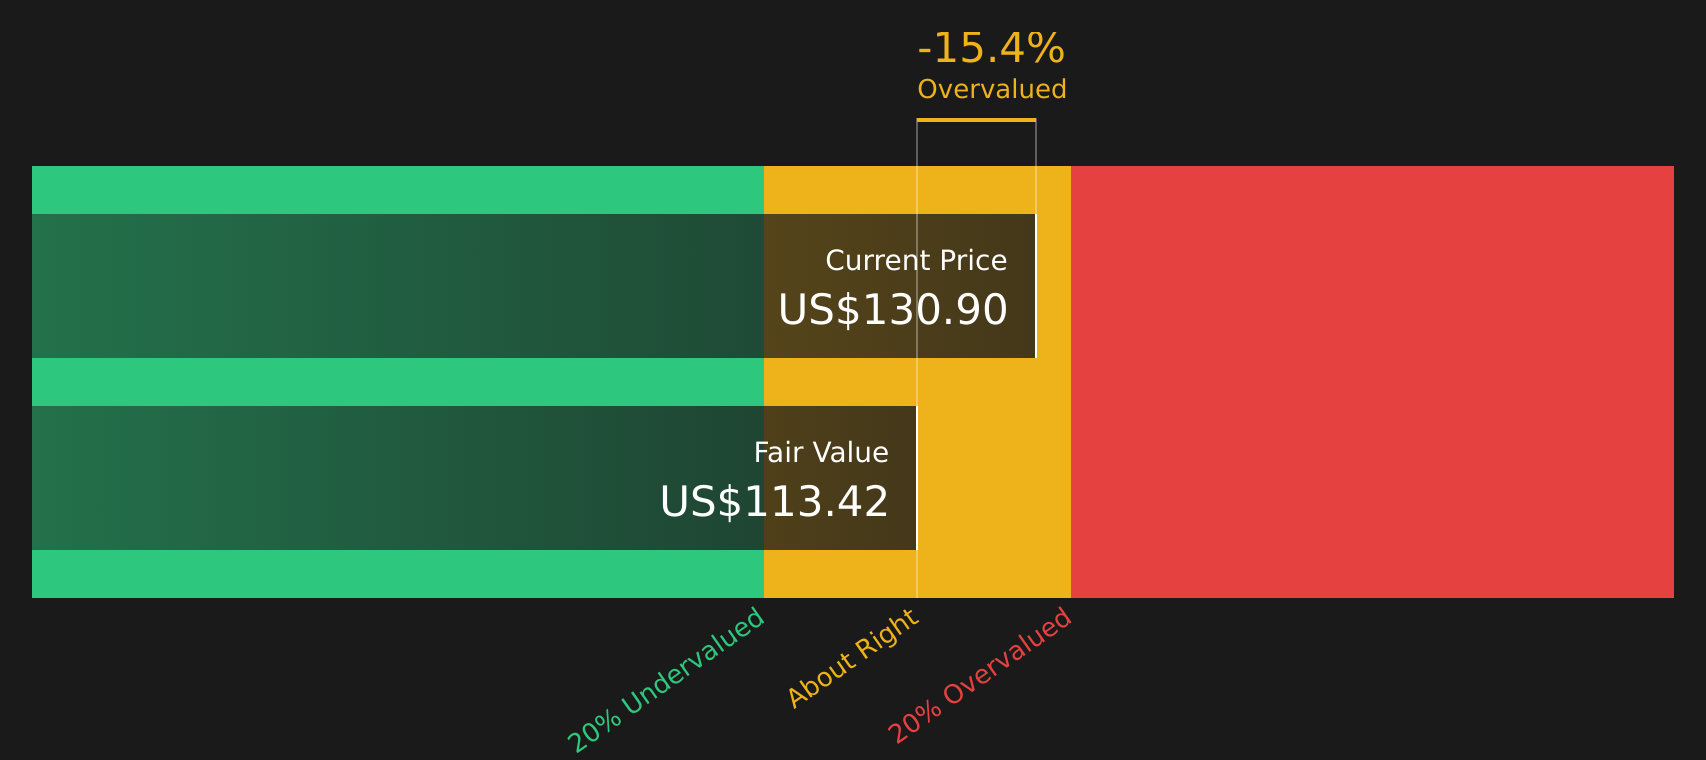
Approach 1: Apollo Global Management Excess Returns Analysis
The Excess Returns model looks at how effectively Apollo Global Management turns shareholder capital into earnings, then compares those earnings with the return that shareholders are assumed to require. It focuses less on cash flows and more on return on equity and the value created above the cost of equity.
For Apollo Global Management, book value is $32.18 per share, while stable earnings per share are estimated at $9.62, based on weighted future return on equity estimates from 6 analysts. That implies an average return on equity of 17.68%. The model applies a cost of equity of $4.12 per share, which leaves an excess return of $5.50 per share, meaning the earnings are above the required return embedded in this framework.
Using these inputs, the model estimates a stable book value of $54.41 per share, based on weighted future book value estimates from 3 analysts, and arrives at an intrinsic value of about $190.78 per share. Compared with the recent share price of $127.79, this Excess Returns valuation suggests the stock is 33.0% undervalued.
Result: UNDERVALUED
Our Excess Returns analysis suggests Apollo Global Management is undervalued by 33.0%. Track this in your watchlist or portfolio, or discover 51 more high quality undervalued stocks.
Approach 2: Apollo Global Management Price vs Earnings
For a profitable company, the P/E ratio is a straightforward way to relate what you pay for the stock to the earnings it generates. It helps you see how many dollars of share price correspond to each dollar of earnings.
What counts as a “normal” P/E usually reflects what the market expects for growth and how much risk investors see in the business. Higher expected growth or lower perceived risk can justify a higher P/E, while slower expected growth or higher risk tends to support a lower P/E.
Apollo Global Management currently trades on a P/E of 63.79x. That stands above the Diversified Financial industry average of 17.08x and the peer average of 20.89x. Simply Wall St’s Fair Ratio for the stock is 23.87x. This Fair Ratio is a proprietary estimate of what the P/E might be given factors such as earnings growth, profit margins, industry, market cap and risk. Because it blends all of these into a single figure, it provides a more tailored reference point than a simple comparison with peers or the broad industry.
Comparing the current P/E of 63.79x with the Fair Ratio of 23.87x suggests the stock is trading above this fair range estimate.
Result: OVERVALUED

P/E ratios tell one story, but what if the real opportunity lies elsewhere? Start investing in legacies, not executives. Discover our 18 top founder-led companies.
Upgrade Your Decision Making: Choose your Apollo Global Management Narrative
Earlier it was mentioned that there is an even better way to understand valuation. Narratives let you turn your view on Apollo Global Management into a clear story that links its business context to a forecast for revenue, earnings and margins, and then to a fair value. This all happens within an easy tool on Simply Wall St’s Community page that updates when new information such as news or earnings is added. You can then compare that fair value with the live share price and decide whether the analyst consensus of US$158.22, the most bullish view of US$178.00 or the most cautious view of US$117.70 feels closer to your own expectations.
Do you think there's more to the story for Apollo Global Management? Head over to our Community to see what others are saying!

This article by Simply Wall St is general in nature. We provide commentary based on historical data and analyst forecasts only using an unbiased methodology and our articles are not intended to be financial advice. It does not constitute a recommendation to buy or sell any stock, and does not take account of your objectives, or your financial situation. We aim to bring you long-term focused analysis driven by fundamental data. Note that our analysis may not factor in the latest price-sensitive company announcements or qualitative material. Simply Wall St has no position in any stocks mentioned.