Is Apple (AAPL) Pricing Reflect Its Growth After Recent Big Tech Sentiment Shift
Apple Inc. AAPL | 255.92 | +0.11% |
- Wondering whether Apple’s current share price really lines up with its underlying value, or if expectations have simply run ahead of the story you are buying into?
- Apple’s stock last closed at US$275.50, with returns of 1.7% year to date and 16.8% over the past year. The 7 day return shows a 0.4% decline, which contrasts with a 5.9% gain over the past 30 days, and returns of 79.9% and 116.2% across the last 3 and 5 years respectively.
- Recent coverage around Apple has continued to focus on its position as a major tech bellwether and on how investors are treating large, cash generative companies in the sector. This context matters because shifts in sentiment toward big tech can quickly change how the market prices Apple’s cash flows and growth profile.
- Right now Apple scores 1 out of 6 on our valuation checks, as shown in its valuation score. Next we will look at what different valuation approaches say about the stock and then finish with a broader way to think about what that number really means for you.
Apple scores just 1/6 on our valuation checks. See what other red flags we found in the full valuation breakdown.
Approach 1: Apple Discounted Cash Flow (DCF) Analysis
A Discounted Cash Flow, or DCF, model projects a company’s future cash flows and then discounts them back to today’s value to estimate what the business might be worth per share right now.
For Apple, the model used is a 2 Stage Free Cash Flow to Equity approach, based on cash flow projections. The latest twelve month free cash flow is about US$124.1b. Analysts have provided estimates out to 2029, and Simply Wall St then extrapolates further, with projected free cash flow of US$193.0b by 2030 and continuing projections through 2035, all expressed in today’s dollars using a discount rate.
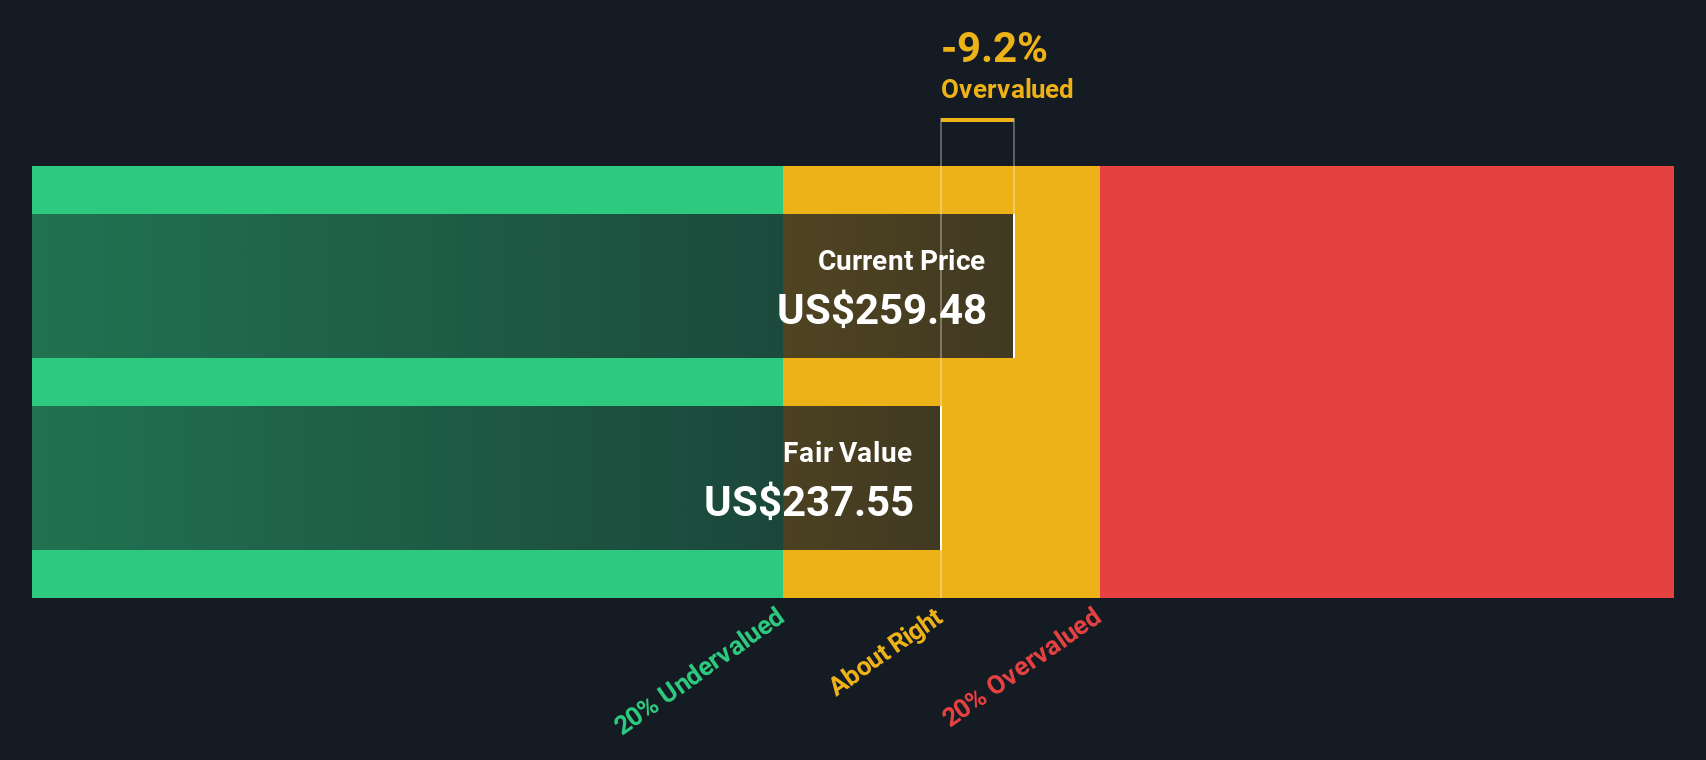
Aggregating these discounted cash flows gives an estimated intrinsic value of US$242.81 per share. Compared to the recent share price of US$275.50, the DCF output suggests Apple is about 13.5% overvalued on this model.
Result: OVERVALUED
Our Discounted Cash Flow (DCF) analysis suggests Apple may be overvalued by 13.5%. Discover 51 high quality undervalued stocks or create your own screener to find better value opportunities.
Approach 2: Apple Price vs Earnings
P/E is a common yardstick for profitable companies because it links what you pay directly to the earnings each share generates. It gives you a quick sense of how many dollars investors are willing to pay today for one dollar of current earnings.
What counts as a “normal” P/E depends on how the market views a company’s growth prospects and risks. Higher expected growth or lower perceived risk can support a higher P/E, while lower growth or higher risk usually point to a lower P/E being more reasonable.
Apple currently trades on a P/E of 34.34x. That is above the Tech industry average of 21.99x and above the peer average of 28.06x. Simply Wall St’s Fair Ratio for Apple is 38.20x, which is their view of a more tailored P/E, based on Apple’s earnings growth profile, industry, profit margins, market cap and risk characteristics.
This Fair Ratio can be more useful than simple peer or industry comparisons because it adjusts for company specific factors rather than assuming all firms should trade on similar multiples. Comparing Apple’s current P/E of 34.34x with the Fair Ratio of 38.20x suggests the shares are trading below that customized benchmark.
Result: UNDERVALUED

P/E ratios tell one story, but what if the real opportunity lies elsewhere? Start investing in legacies, not executives. Discover our 22 top founder-led companies.
Upgrade Your Decision Making: Choose your Apple Narrative
Earlier we mentioned that there is an even better way to understand valuation, so let us introduce you to Narratives, which are simply your story about Apple linked directly to a set of numbers like fair value, future revenue, earnings and margins.
On Simply Wall St, a Narrative connects what you believe about Apple’s business, such as whether services gradually take over from hardware or tariffs squeeze margins, to a full financial forecast and then to a fair value per share that you can compare with today’s price.
These Narratives live on the Community page. They are used by millions of investors, refresh automatically when new information such as earnings or news arrives, and help you decide whether Apple looks expensive or attractive by showing how your fair value compares with the current market price.
For Apple, some users see a fair value near US$166.02 or US$174.08 based on more cautious stories. Others land closer to US$283.66 or around US$291.65 on more optimistic assumptions, and viewing these side by side can help you decide which version of Apple’s future you are actually investing in.
For Apple however, we will make it really easy for you with previews of two leading Apple Narratives:
Fair value: US$309.04
Share price vs this fair value: about 10.9% below that fair value on this narrative
Revenue growth used in this story: 9.69%
- Sees Apple Vision Pro, Apple Arcade updates and new Mac hardware as clear proof points for the current product cycle.
- Argues the new MacBook Air and Mac Studio with the latest chips can appeal strongly to coders and power users.
- Leans heavily on Tim Cook’s leadership and ongoing product rollouts as support for a higher fair value.
Fair value: US$207.71
Share price vs this fair value: about 32.6% above that fair value on this narrative
Revenue growth used in this story: 6.39%
- Highlights risks from higher manufacturing and compliance costs, particularly around US chip sourcing and EU rules.
- Questions how much growth Apple can get from markets like India and South America given income levels, competition and localization issues.
- Sees Services and new technologies like Apple Vision Pro as carrying real execution risk, including regulatory pressure and uncertain demand.
Together these two Narratives show how the same company can produce very different fair values depending on what you believe about products, regulation, new markets and margins. If you want to go beyond these previews and see every assumption in detail, the full set of Narratives on Apple is set up so you can stress test your own view against the community and track how your numbers stack up as new data arrives.
Do you think there's more to the story for Apple? Head over to our Community to see what others are saying!

This article by Simply Wall St is general in nature. We provide commentary based on historical data and analyst forecasts only using an unbiased methodology and our articles are not intended to be financial advice. It does not constitute a recommendation to buy or sell any stock, and does not take account of your objectives, or your financial situation. We aim to bring you long-term focused analysis driven by fundamental data. Note that our analysis may not factor in the latest price-sensitive company announcements or qualitative material. Simply Wall St has no position in any stocks mentioned.