Is ATI (ATI) Still Attractively Priced After 113% One Year Share Price Surge?
ATI Inc. ATI | 156.83 | -3.80% |
- If you are wondering whether ATI's current share price still reflects good value, it helps to step back from the headline moves and look closely at what the fundamentals suggest.
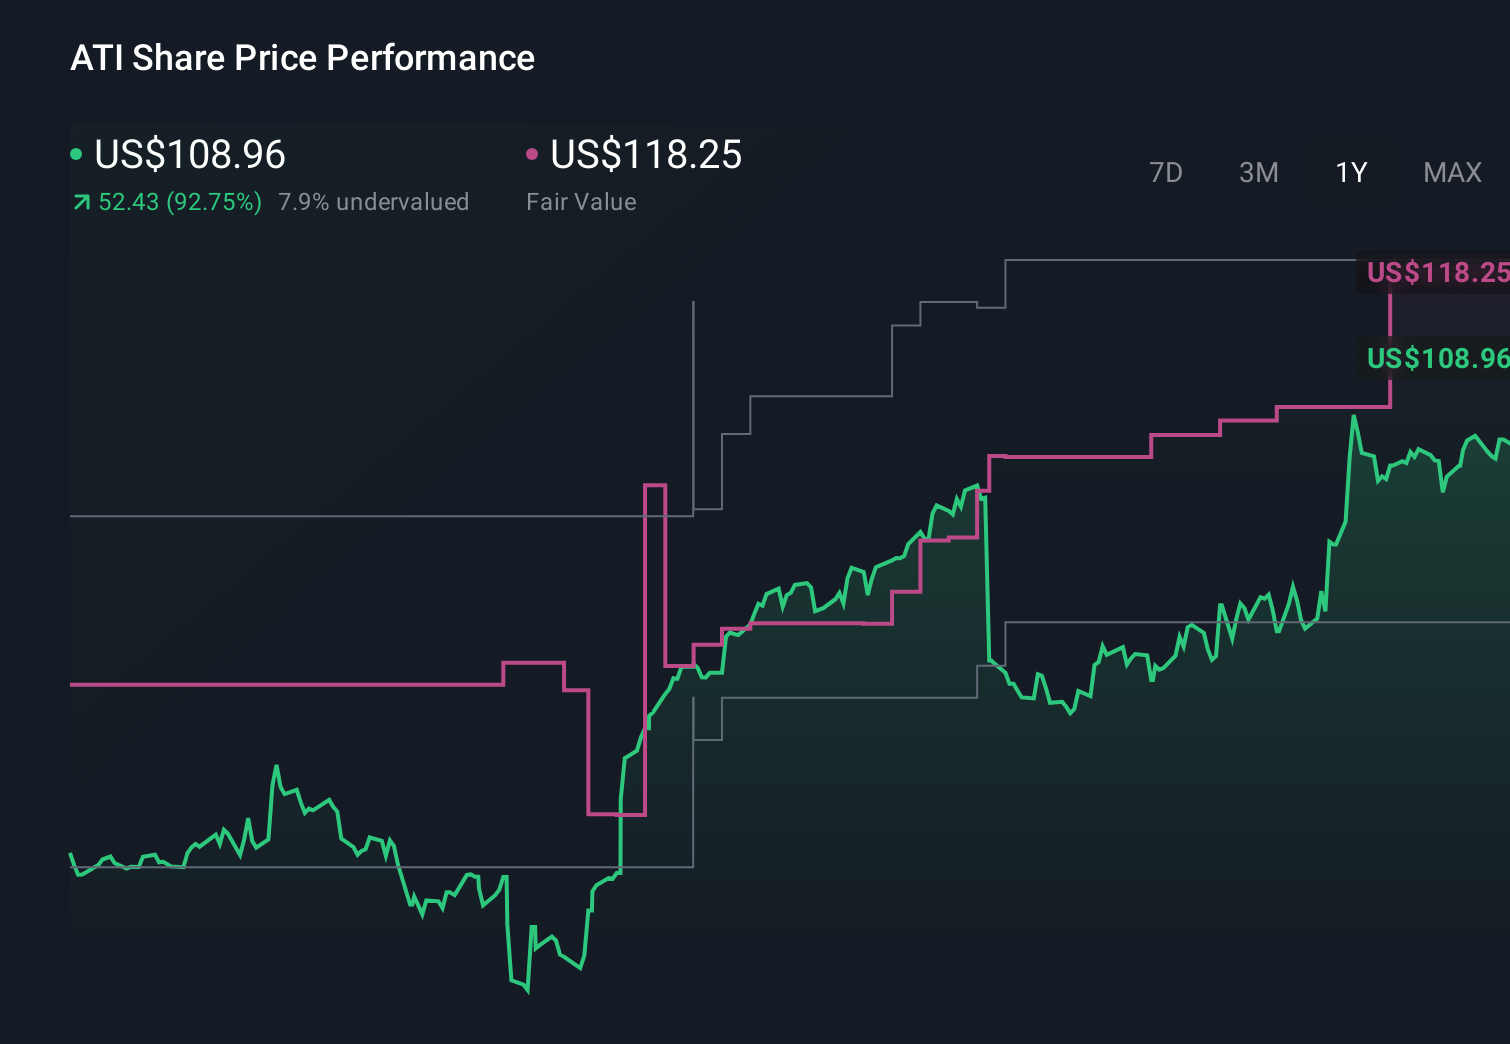
- ATI has seen strong recent returns, with the share price at US$133.57 and returns of 11.0% over 7 days, 10.5% over 30 days, 12.1% year to date and 112.8% over 1 year, while the 3 year return is 245.9% and the 5 year return is very large.
- Recent news coverage has focused on ATI's role in capital goods and advanced materials, with attention on how its products fit into aerospace, energy and industrial supply chains. These themes have given investors more information to weigh against the recent share price performance.
- Despite the strong share price history, ATI currently has a valuation score of 0 out of 6. Next, we look at what different valuation methods say about that score and then consider a broader way to think about value that goes beyond any single model.
ATI scores just 0/6 on our valuation checks. See what other red flags we found in the full valuation breakdown.
Approach 1: ATI Discounted Cash Flow (DCF) Analysis
The Discounted Cash Flow model looks at the cash ATI is expected to generate in the future and brings those projected cash flows back to today using a discount rate. This provides an estimate of what the business might be worth at present.
For ATI, the model used is a 2 Stage Free Cash Flow to Equity approach based on cash flows available to shareholders. The latest twelve month free cash flow is reported at $362.7 million. Analysts have provided estimates for several years ahead, and Simply Wall St then extends those projections further. By 2029, projected free cash flow is $702.4 million. Discounted values are provided for each year through 2035, all in dollars.
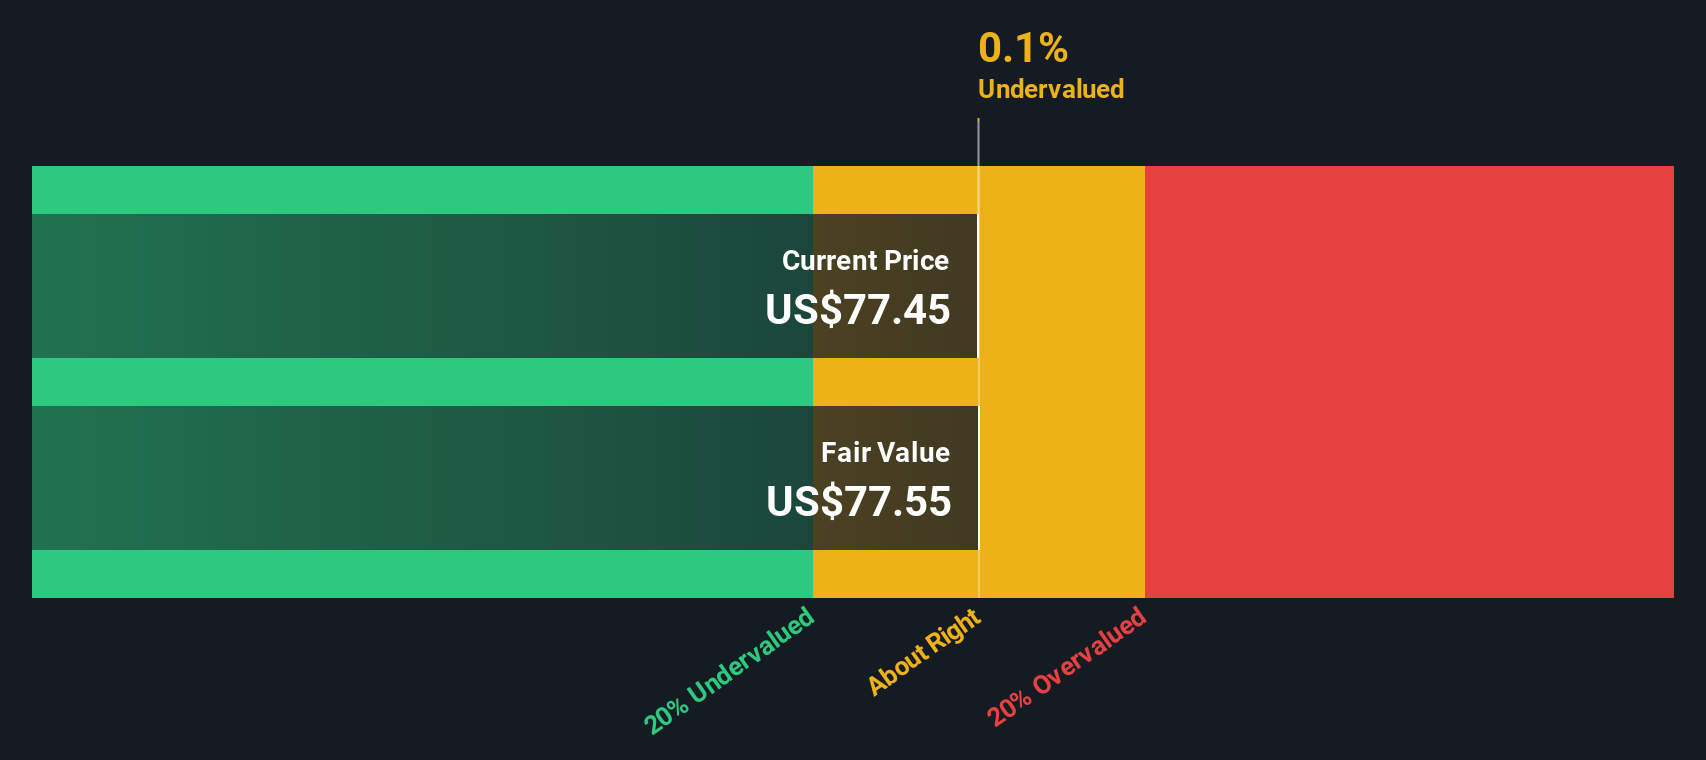
When these projected cash flows are combined and discounted, the model produces an estimated intrinsic value of $119.01 per share. Compared with the current share price of $133.57, the DCF output suggests ATI is about 12.2% overvalued based on these assumptions and projections.
Result: OVERVALUED
Our Discounted Cash Flow (DCF) analysis suggests ATI may be overvalued by 12.2%. Discover 53 high quality undervalued stocks or create your own screener to find better value opportunities.
Approach 2: ATI Price vs Earnings
For profitable companies like ATI, the P/E ratio is a straightforward way to think about value because it links what you pay today to the earnings the business is currently generating. A higher P/E usually reflects stronger growth expectations or lower perceived risk, while a lower P/E can be tied to more modest growth assumptions or higher uncertainty.
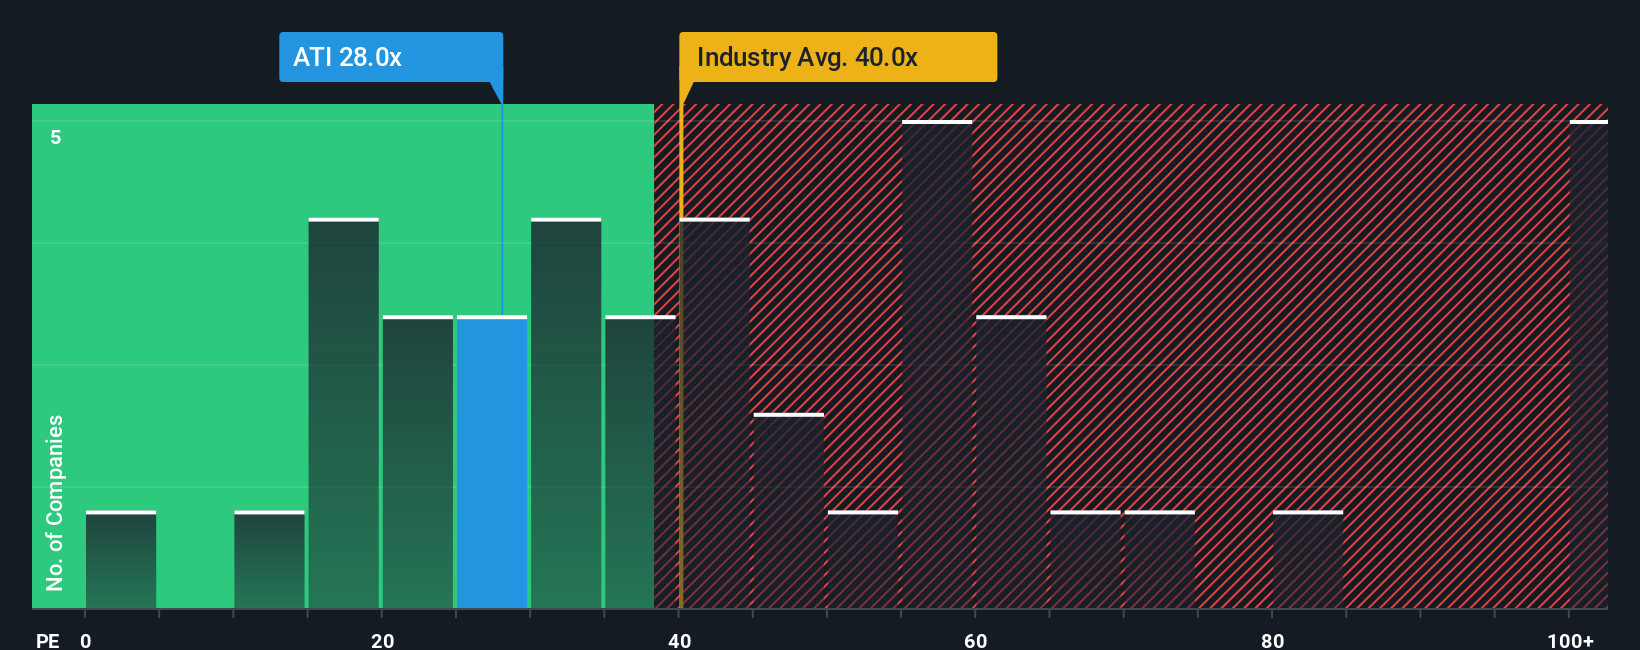
ATI currently trades on a P/E of 44.89x. That sits above the Aerospace & Defense industry average of 41.28x and the peer group average of 36.15x, which suggests investors are currently paying a higher price for each dollar of ATI’s earnings compared with many peers. Simply Wall St’s Fair Ratio for ATI is 35.00x. This Fair Ratio is a proprietary estimate of what ATI’s P/E might be given its earnings growth profile, profit margins, industry, market cap and risk characteristics.
Because the Fair Ratio incorporates these company specific factors, it can be more informative than a simple comparison to industry or peer averages alone. Lining up the current P/E of 44.89x against the Fair Ratio of 35.00x points to ATI trading above that fair level on this metric.
Result: OVERVALUED
P/E ratios tell one story, but what if the real opportunity lies elsewhere? Start investing in legacies, not executives. Discover our 22 top founder-led companies.
Upgrade Your Decision Making: Choose your ATI Narrative
Earlier we mentioned that there is an even better way to understand valuation, so let us introduce you to Narratives, which are simply your own story about a company tied directly to the numbers you think are reasonable for its future revenue, earnings, margins and fair value.
On Simply Wall St, within the Community page used by millions of investors, a Narrative links what you believe about a business to a clear financial forecast and then to a fair value estimate that you can compare with the current share price to help inform whether you want to buy, hold or sell.
Narratives are easy to set up, are updated automatically when fresh information such as news or earnings is available, and always show how your assumed fair value compares with the live market price.
For ATI for example, one investor might publish a Narrative with a very optimistic fair value based on assumptions of higher revenue growth and stronger margins, while another might post a much lower fair value based on more cautious assumptions, giving you a clear range of views to consider alongside your own.
Do you think there's more to the story for ATI? Head over to our Community to see what others are saying!
This article by Simply Wall St is general in nature. We provide commentary based on historical data and analyst forecasts only using an unbiased methodology and our articles are not intended to be financial advice. It does not constitute a recommendation to buy or sell any stock, and does not take account of your objectives, or your financial situation. We aim to bring you long-term focused analysis driven by fundamental data. Note that our analysis may not factor in the latest price-sensitive company announcements or qualitative material. Simply Wall St has no position in any stocks mentioned.