Is Banner Set for a Rebound After a 16.7% Decline This Year?
Banner Corporation BANR | 60.68 60.68 | 0.00% 0.00% Pre |
- Curious if Banner stock is trading at a bargain or overpriced? You're not alone. Let's dig into its real value together.
- Banner's share price closed at $60.41, sliding 1.1% this week and 4.2% over the last month, with a year-to-date drop of 8.5% and a notable 16.7% dip over the past year. Over the past five years, the stock delivered a strong 62.1% return.
- Recent news around changing regulatory landscapes for regional banks and shifting investor sentiment has helped influence these moves. Headlines highlight industry consolidation and increased competition, both of which offer important context for understanding where Banner is heading next.
- If you're wondering how Banner stacks up on a pure numbers basis, it currently scores 4 out of 6 on our valuation checks. We'll break down exactly what this means using traditional valuation methods, but keep an eye out for an even smarter way to think about value that we'll share at the end of this article.
Approach 1: Banner Excess Returns Analysis
The Excess Returns valuation model estimates a company’s intrinsic value by considering how much profit it generates on shareholder equity compared to the required rate of return (cost of equity). This approach focuses on Banner’s ability to deliver returns above what shareholders could expect elsewhere and is particularly relevant for evaluating banks and financial institutions.
For Banner, analysts project a Book Value of $55.71 per share and a Stable Earnings Per Share (EPS) of $6.16, based on the latest estimates from four analysts. The company’s Cost of Equity, or the minimum annual return demanded by shareholders, stands at $4.13 per share. The calculated Excess Return is $2.03 per share, with an average Return on Equity of 10.10%. Looking ahead, the Stable Book Value is projected at $60.99 per share, supported by inputs from five analysts.
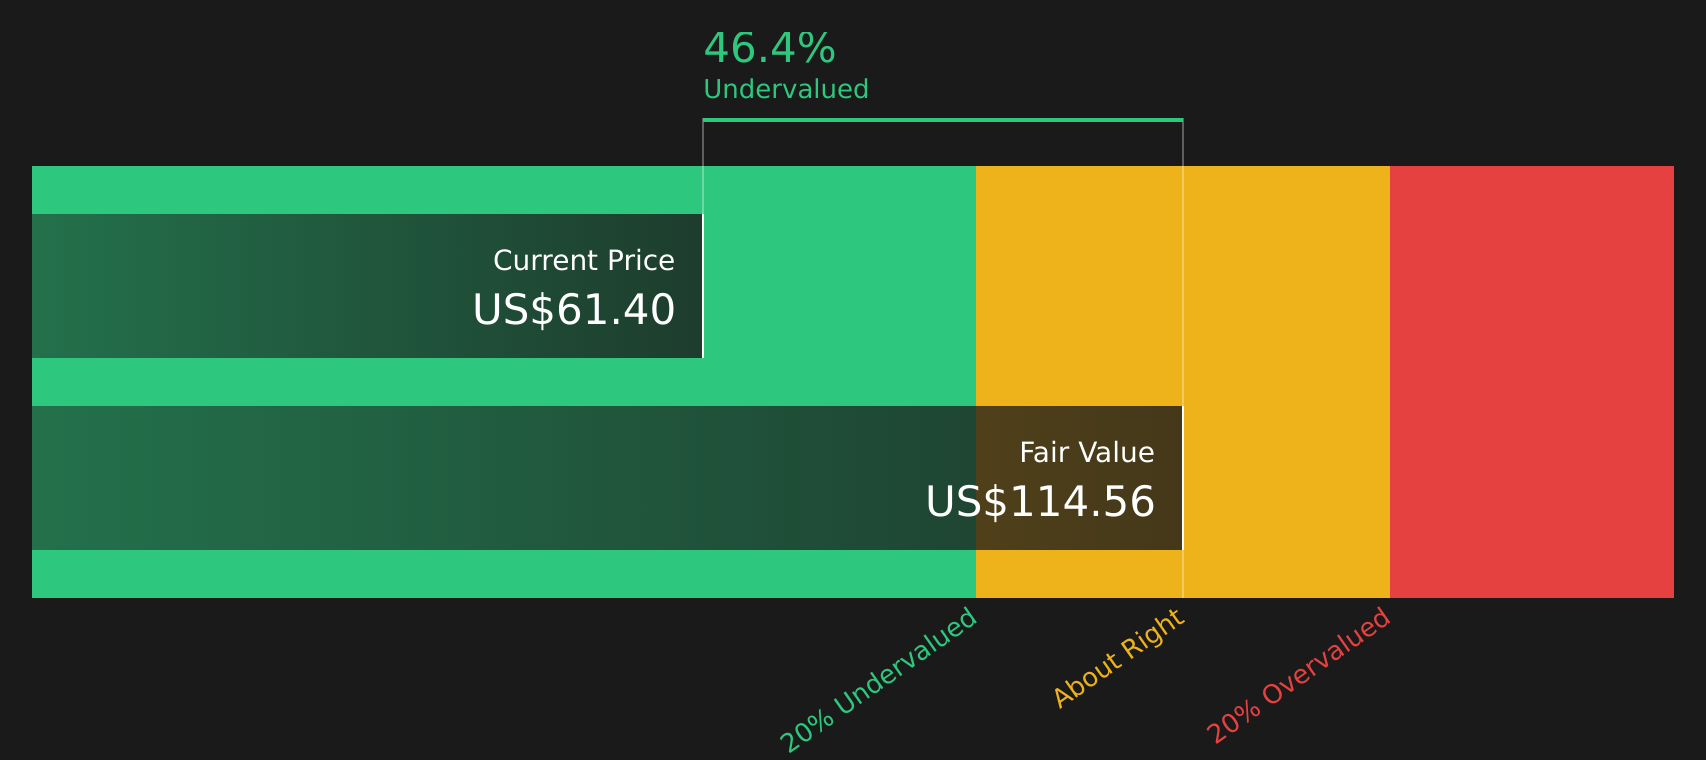
This model’s assessment places Banner’s intrinsic value at $115.81 per share, which is a 47.8% discount to its recent close of $60.41. That substantial gap suggests the stock is significantly undervalued according to this methodology. This indicates that investors may be underestimating Banner’s long-term earning power and profitability.
Result: UNDERVALUED
Our Excess Returns analysis suggests Banner is undervalued by 47.8%. Track this in your watchlist or portfolio, or discover 836 more undervalued stocks based on cash flows.
Approach 2: Banner Price vs Earnings
The Price-to-Earnings (PE) ratio is a widely used metric for valuing profitable companies like Banner, as it links what investors are willing to pay for each dollar of earnings. For companies with stable profits, the PE ratio offers a straightforward way to compare value across the industry and against peers.
It is important to remember, though, that a "normal" or "fair" PE ratio can vary based on how much a company is expected to grow and how risky its earnings are. Faster-growing or less risky companies typically justify higher PE ratios, while slower-growing or riskier companies often trade at lower ones.
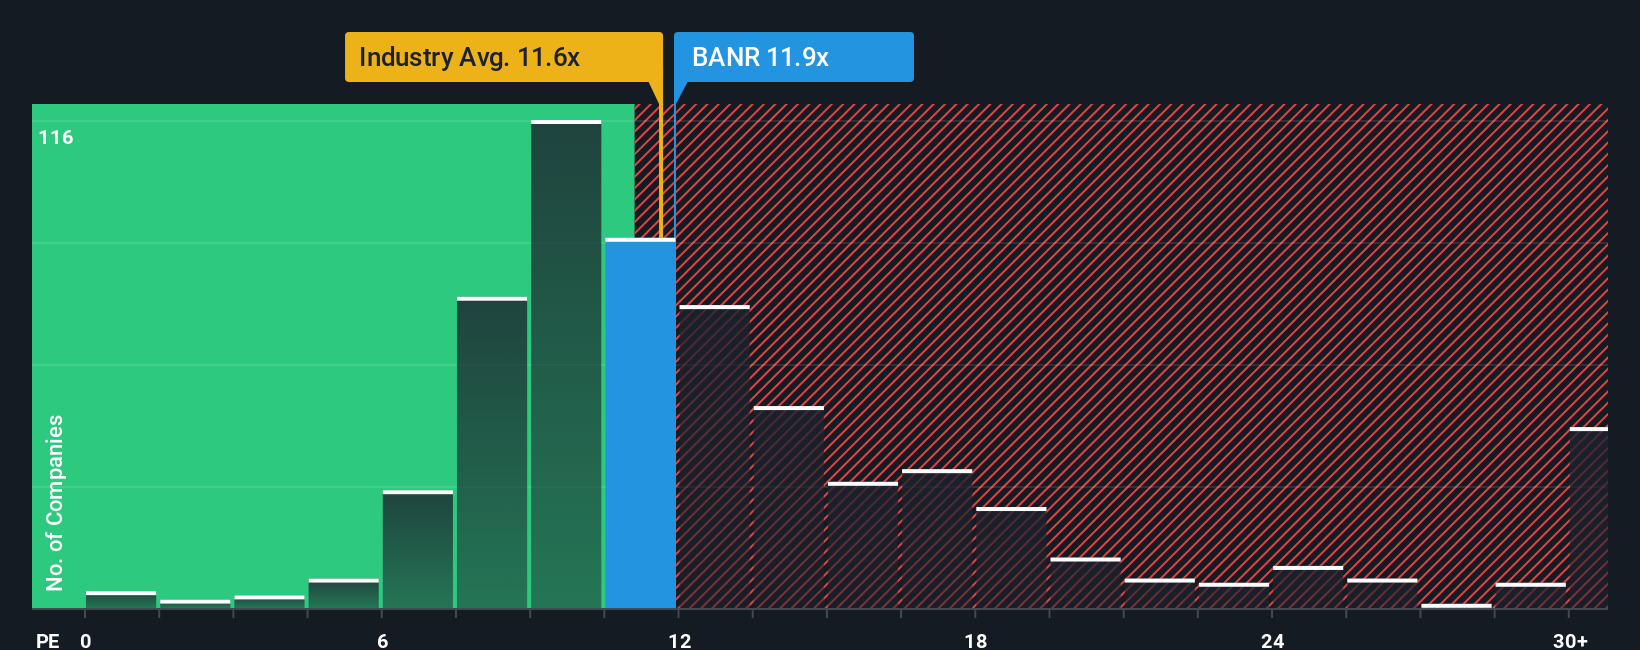
Banner currently trades at a PE ratio of 10.8x. For context, the Banks industry average stands at 11.1x, and the average among Banner’s close peers is 13.4x. At first glance, this positions Banner slightly below typical valuations, hinting at market skepticism or lower growth expectations.
This is where Simply Wall St’s proprietary “Fair Ratio” comes in. The Fair Ratio for Banner is 10.6x, which is calculated by weighing factors like its projected earnings growth, profit margins, market capitalization, risk profile, and the nature of the banking industry itself. Unlike a simple comparison with peers or the sector, the Fair Ratio aims to capture the company’s true fair value in context. This approach makes it more tailored and meaningful for investors seeking a deeper analysis.
Comparing Banner’s current PE of 10.8x to its Fair Ratio of 10.6x suggests the share price is almost exactly aligned with what you would expect given the company’s fundamentals.
Result: ABOUT RIGHT
PE ratios tell one story, but what if the real opportunity lies elsewhere? Discover 1406 companies where insiders are betting big on explosive growth.
Upgrade Your Decision Making: Choose your Banner Narrative
Earlier, we mentioned there is an even better way to understand valuation, so let’s introduce you to Narratives. A Narrative is your story behind the numbers. It combines your perspective on a company’s future (such as your estimates for its revenue, earnings, and margins) into a financial forecast that leads to a fair value. Narratives link a company’s story and catalysts, the financials you expect, and your personal view on what it’s worth, creating a complete and contextual view of an investment.
Simply Wall St makes Narratives simple and accessible through the Community page used by millions of investors, allowing you to voice your expectations, set your own assumptions, and compare your fair value to the current price so you can decide when to buy or sell. Whenever key news or earnings updates come through, Narratives refresh dynamically so your investment thesis always stays relevant. For Banner, one investor may build a Narrative around strong Pacific Northwest growth and project a fair value well above today’s price, while another might emphasize risks from commercial real estate exposure and see much less upside.
Do you think there's more to the story for Banner? Head over to our Community to see what others are saying!

This article by Simply Wall St is general in nature. We provide commentary based on historical data and analyst forecasts only using an unbiased methodology and our articles are not intended to be financial advice. It does not constitute a recommendation to buy or sell any stock, and does not take account of your objectives, or your financial situation. We aim to bring you long-term focused analysis driven by fundamental data. Note that our analysis may not factor in the latest price-sensitive company announcements or qualitative material. Simply Wall St has no position in any stocks mentioned.