Is Beacon Financial (BBT) Pricing Reflect Long Term Value After Recent Share Price Gains
Beacon Financial Corporation BBT | 31.59 | -0.35% |
- Wondering if Beacon Financial's current share price gives you a fair deal or leaves value on the table? This article focuses squarely on what the numbers suggest about where the stock stands today.
- Beacon Financial has recently traded at US$30.98, with returns of 7.1% over the past week, 15.0% over the last month, 17.3% year to date and 2.9% over the past year, which has caught the attention of investors watching for shifts in sentiment and risk.
- These moves come as investors look more closely at Beacon Financial's positioning within the banking sector and how the market is currently pricing its prospects compared to peers. The recent share performance provides a useful backdrop for assessing whether the valuation is stretching ahead of fundamentals or not keeping pace.
- On our valuation framework, Beacon Financial currently scores 2 out of 6, reflecting the checks where it screens as undervalued. Next, we will walk through the key valuation methods behind that score, then finish by looking at a more complete way to think about what the stock might be worth.
Beacon Financial scores just 2/6 on our valuation checks. See what other red flags we found in the full valuation breakdown.
Approach 1: Beacon Financial Excess Returns Analysis
The Excess Returns model looks at how much profit Beacon Financial is expected to generate over and above the return that equity investors typically require. Instead of focusing on cash flows, it starts with the bank’s equity base and estimates how efficiently that capital is used over time.
For Beacon Financial, the model uses a Book Value of $29.70 per share and a Stable EPS of $3.83 per share, based on weighted future Return on Equity estimates from 5 analysts. The implied Cost of Equity is $2.33 per share, which leads to an Excess Return of $1.50 per share, meaning the expected earnings are above the required return. The Average Return on Equity used is 11.47%, and the Stable Book Value assumption is $33.36 per share, also sourced from 5 analysts’ estimates.
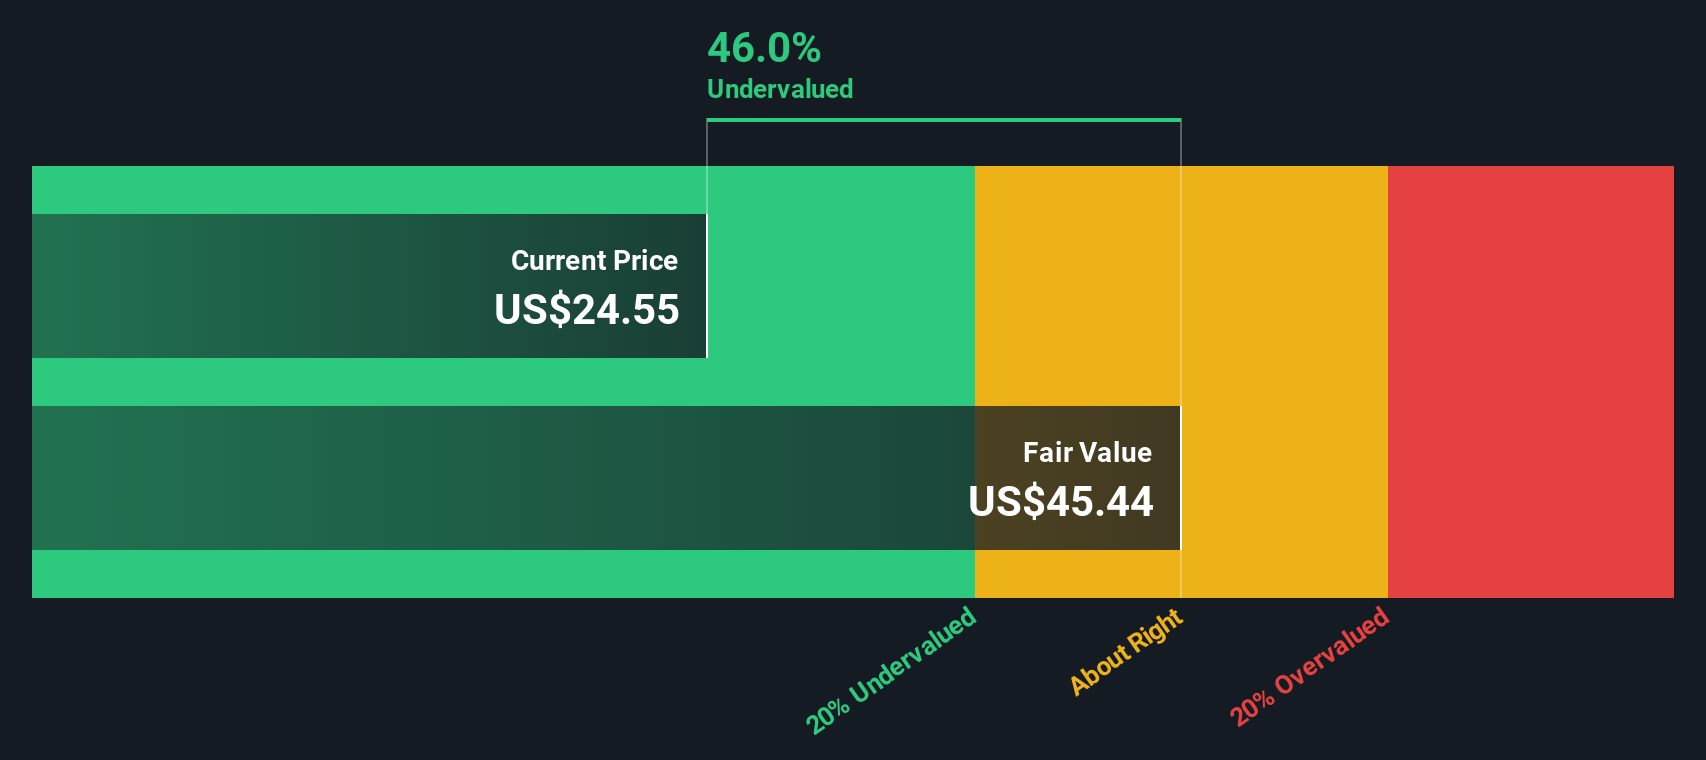
Combining these inputs, the Excess Returns framework produces an intrinsic value of about $75.38 per share. Compared with the recent share price of $30.98, this suggests Beacon Financial screens as materially undervalued based on this method, with an intrinsic discount of 58.9%.
Result: UNDERVALUED
Our Excess Returns analysis suggests Beacon Financial is undervalued by 58.9%. Track this in your watchlist or portfolio, or discover 55 more high quality undervalued stocks.
Approach 2: Beacon Financial Price vs Earnings
For a profitable bank like Beacon Financial, the P/E ratio is a useful way to relate what you pay per share to the earnings the business is currently generating. Investors typically accept a higher or lower P/E depending on their expectations for future earnings and the level of risk they see in the business.
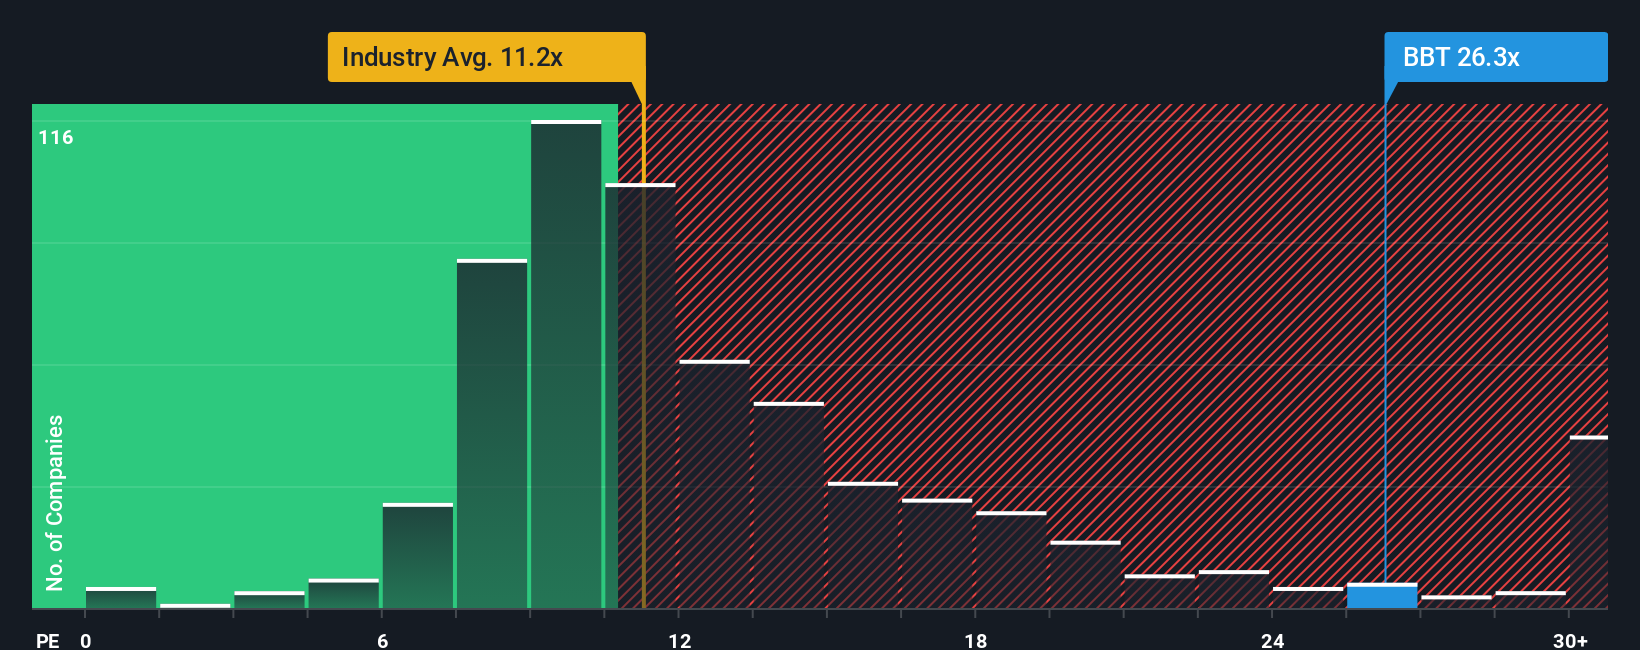
Beacon Financial currently trades on a P/E of 28.84x. That sits above the Banks industry average of 11.95x and also above the peer group average of 14.06x. On the surface, that gap suggests the market is placing a richer price on Beacon Financial's earnings than on many sector peers.
Simply Wall St's Fair Ratio framework suggests a P/E of 21.88x for Beacon Financial. This proprietary metric aims to estimate a more tailored P/E by blending factors such as earnings growth, profit margins, risk profile, industry and market cap, rather than relying only on blunt peer or industry comparisons. Because it is tuned to the company’s own characteristics, it can offer a more targeted reference point for what might be a reasonable earnings multiple.
Comparing the Fair Ratio of 21.88x with the current 28.84x P/E, Beacon Financial screens as trading above that fair range on this metric.
Result: OVERVALUED
P/E ratios tell one story, but what if the real opportunity lies elsewhere? Start investing in legacies, not executives. Discover our 22 top founder-led companies.
Upgrade Your Decision Making: Choose your Beacon Financial Narrative
Earlier we mentioned that there is an even better way to understand valuation, so let us introduce you to Narratives, a simple way for you to put your own story about Beacon Financial into the numbers you see on the screen.
A Narrative lets you spell out what you believe about the business, then connects that story to a financial forecast for revenue, earnings and margins, and finally to an implied fair value per share that you can compare with today’s price.
On Simply Wall St, Narratives sit inside the Community page and are designed to be easy to use. You can adjust assumptions, see how your fair value shifts, and quickly compare it with Beacon Financial's current share price to help you decide whether you see it as an opportunity or something to be cautious about.
Because Narratives update when new information such as earnings results or major news is added, you do not need to rebuild your thinking from scratch. You can even see how one Beacon Financial investor might plug in very optimistic revenue and margin estimates and arrive at a far higher fair value than another investor who uses more conservative assumptions and ends up with a much lower figure.
Do you think there's more to the story for Beacon Financial? Head over to our Community to see what others are saying!

This article by Simply Wall St is general in nature. We provide commentary based on historical data and analyst forecasts only using an unbiased methodology and our articles are not intended to be financial advice. It does not constitute a recommendation to buy or sell any stock, and does not take account of your objectives, or your financial situation. We aim to bring you long-term focused analysis driven by fundamental data. Note that our analysis may not factor in the latest price-sensitive company announcements or qualitative material. Simply Wall St has no position in any stocks mentioned.