Is Belden (BDC) Finally Fairly Priced After Its Strong Recent Share Price Rally?
Belden Inc. BDC | 130.25 130.25 | +0.01% 0.00% Pre |
- Wondering if Belden at around US$139.75 is priced for perfection or still offers room for value? This article will walk you through what the current market price might be implying.
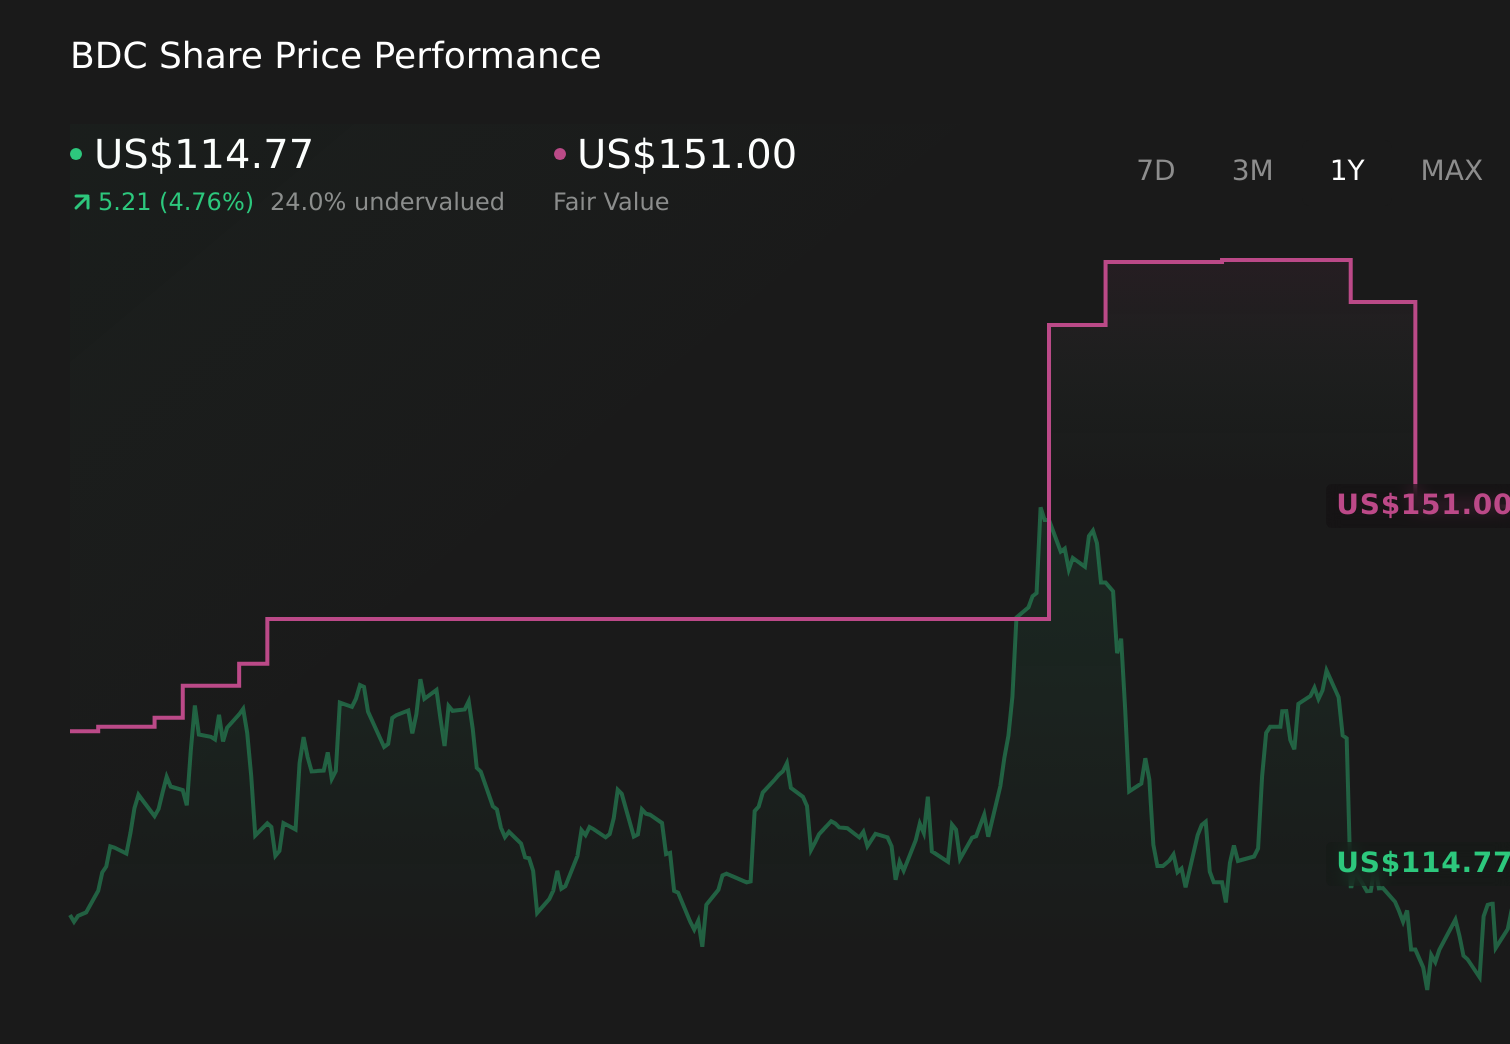
- The stock has seen strong recent moves, with returns of 18.9% over 7 days, 23.5% over 30 days, 18.6% year to date, 21.6% over 1 year, 58.3% over 3 years and 212.3% over 5 years.
- Recent coverage of Belden has focused on its position in the technology and connectivity space and how investors are reacting to that story in the share price. While short term sentiment can shift quickly, these headlines help explain why the stock has attracted fresh attention at current levels.
- On our valuation checks, Belden scores 2 out of 6. Next we will look at what different valuation approaches say about that price tag and finish by highlighting a cleaner way to pull all those methods together.
Belden scores just 2/6 on our valuation checks. See what other red flags we found in the full valuation breakdown.
Approach 1: Belden Discounted Cash Flow (DCF) Analysis
A Discounted Cash Flow, or DCF, model estimates what a business might be worth today by projecting its future cash flows and then discounting those back into today’s dollars.
For Belden, the model uses a 2 Stage Free Cash Flow to Equity approach based on cash flow projections. The latest twelve month Free Cash Flow is around $230.6 million, and analyst data plus Simply Wall St extrapolations project Free Cash Flow out to 2035, reaching $437.9 million in that year. These projections are all in $ and sit well below the 1b mark, so this points to a mid sized cash generator rather than a giant.
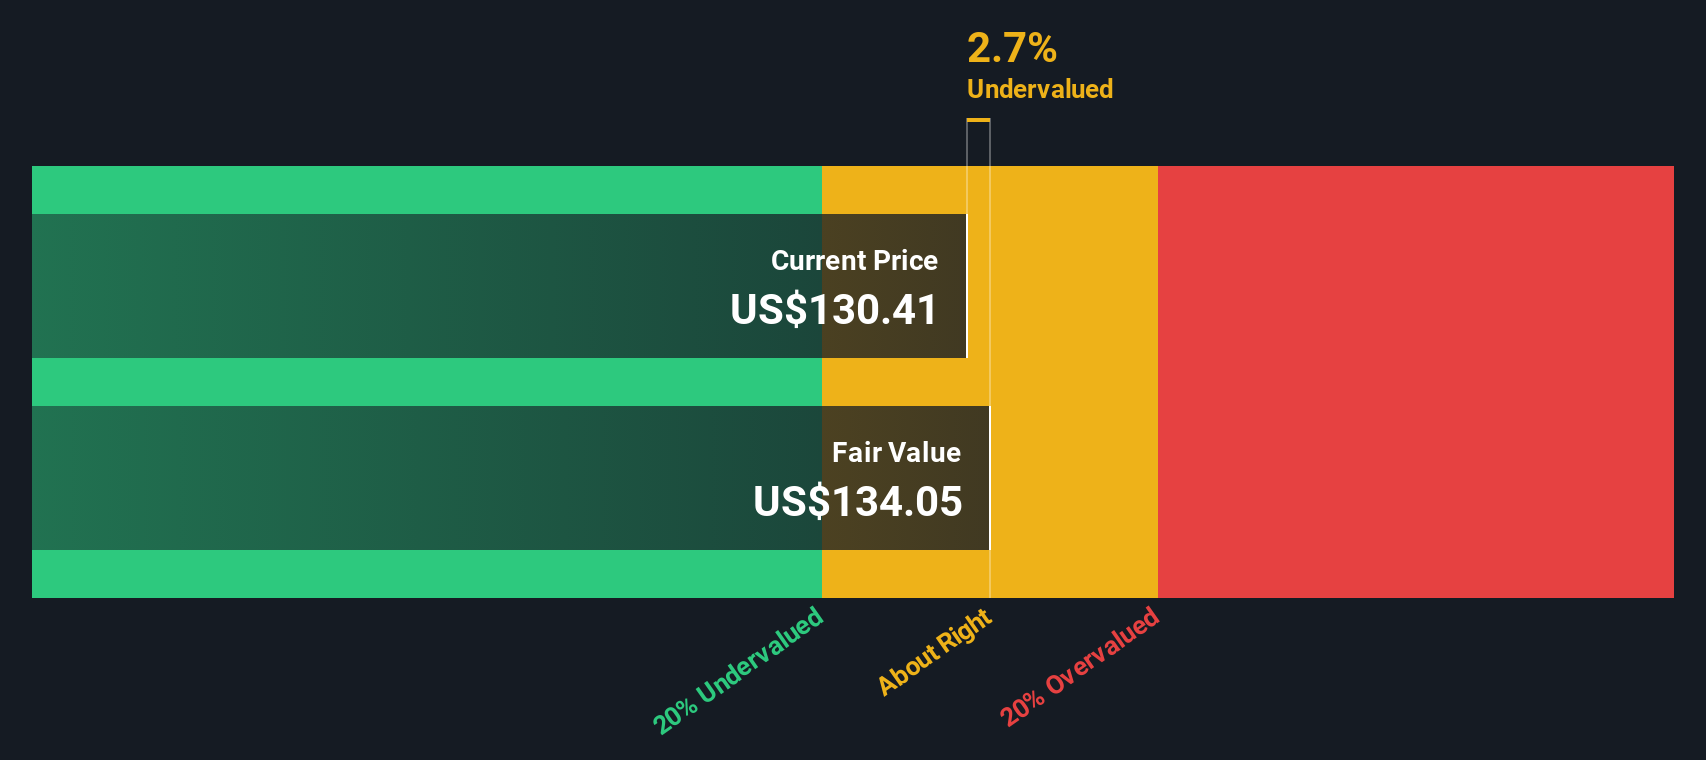
Aggregating all those future cash flows, the DCF model arrives at an estimated intrinsic value of $142.52 per share. Compared with the recent share price of about $139.75, that suggests Belden trades at roughly a 1.9% discount, which is very small in the context of normal market swings.
Result: ABOUT RIGHT
Belden is fairly valued according to our Discounted Cash Flow (DCF), but this can change at a moment's notice. Track the value in your watchlist or portfolio and be alerted on when to act.
Approach 2: Belden Price vs Earnings
For a profitable company, the P/E ratio is a helpful way to see what you are paying for each dollar of earnings and how that compares with alternatives. A higher or lower P/E often reflects what the market is baking in for growth and how much risk investors are prepared to accept for that growth.
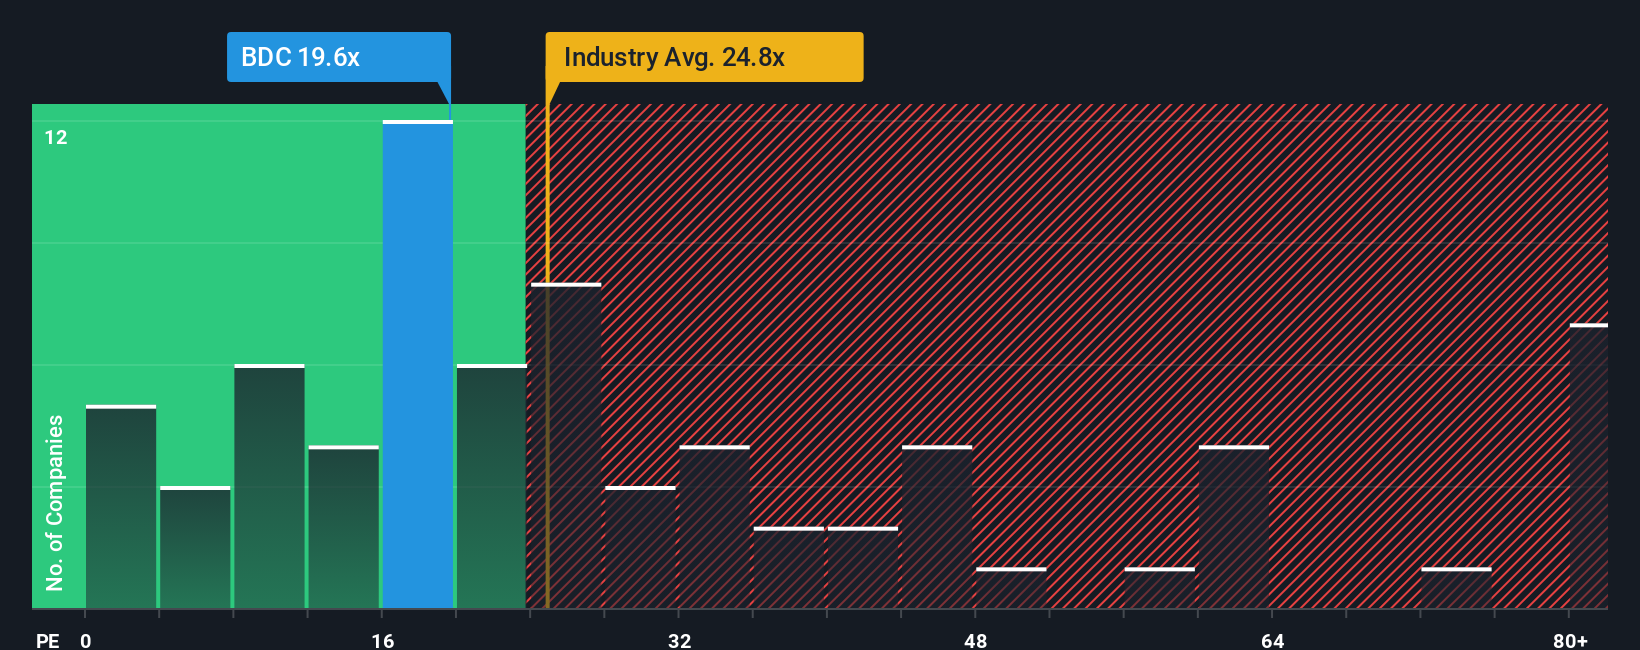
Belden currently trades on a P/E of 24.09x. That sits below the Electronic industry average of about 27.44x, but well above the peer average of roughly 7.16x. On the surface, that mix of signals can be hard to interpret, because simple averages do not adjust for company specific factors.
Simply Wall St’s Fair Ratio aims to solve that. It is a proprietary estimate of what a more tailored P/E might be, given inputs like Belden’s earnings growth profile, profit margins, industry, market cap and risk indicators. Because it adjusts for these elements, it can be more informative than a straight comparison with peers or the broad industry.
For Belden, the Fair Ratio stands at 23.07x versus the actual P/E of 24.09x, a small gap that points to the shares being priced close to that tailored estimate.
Result: ABOUT RIGHT
P/E ratios tell one story, but what if the real opportunity lies elsewhere? Start investing in legacies, not executives. Discover our 22 top founder-led companies.
Upgrade Your Decision Making: Choose your Belden Narrative
Earlier we mentioned that there is an even better way to understand valuation, so let us introduce you to Narratives, a simple way for you to spell out the story you believe about Belden and connect that story to your assumptions for future revenue, earnings, margins and ultimately fair value.
A Narrative links three things in one place: what you think is happening at the company, how that translates into a financial forecast, and what you think a fair value per share looks like based on those estimates.
On Simply Wall St, Narratives sit inside the Community page and are used by millions of investors as an easy tool to compare their own fair value to the current share price, which can help them decide whether Belden looks attractive, fully priced or expensive at any given time.
Narratives update automatically when new information such as company news or earnings is added to the platform, so your story, the forecast, and the fair value estimate stay aligned with the latest data without you having to rebuild everything from scratch.
For example, one Belden Narrative might see higher margins and assign a fair value well above the current price, while another expects softer revenue growth, lower profitability and a fair value closer to or below today’s price.
Do you think there's more to the story for Belden? Head over to our Community to see what others are saying!
This article by Simply Wall St is general in nature. We provide commentary based on historical data and analyst forecasts only using an unbiased methodology and our articles are not intended to be financial advice. It does not constitute a recommendation to buy or sell any stock, and does not take account of your objectives, or your financial situation. We aim to bring you long-term focused analysis driven by fundamental data. Note that our analysis may not factor in the latest price-sensitive company announcements or qualitative material. Simply Wall St has no position in any stocks mentioned.