Is BILL Holdings (BILL) Pricing Reflect Its Recent Multi Year Share Price Declines
BILL Holdings BILL | 38.63 | +0.49% |
- If you are looking at BILL Holdings and wondering whether the current share price offers fair value, this article will walk through what the numbers are really saying about the stock.
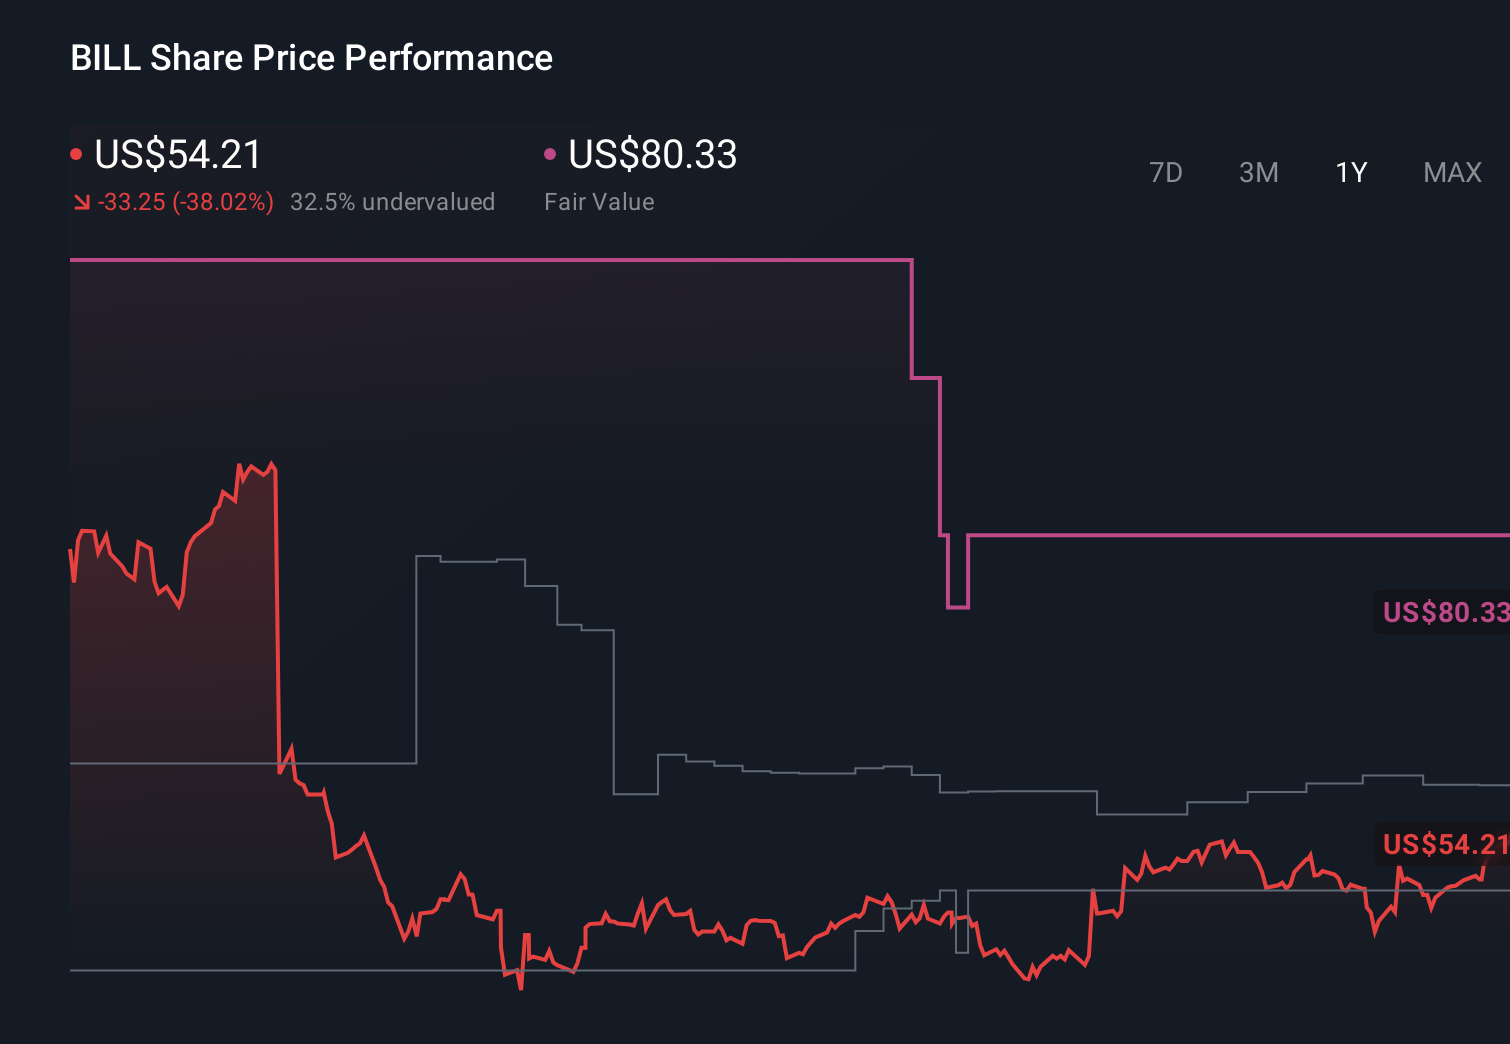
- BILL has recently traded at US$54.48, with a 7.8% return over the last 7 days, a 2.0% decline over 30 days, a 7.8% return year to date, and longer term returns of a 34.5% decline over 1 year, a 47.3% decline over 3 years, and a 57.4% decline over 5 years.
- Recent coverage has focused on how BILL fits into the broader software and digital payments space, including discussions around competitive pressures and changing adoption rates for business payment solutions. This context helps explain why the market has been reassessing the risk and reward trade off for the stock over different time periods.
- On our checks, BILL earns a valuation score of 5 out of 6. Next, we will break down what different valuation approaches suggest about the shares, then finish with a framework that can help you make better sense of those valuation signals.
Approach 1: BILL Holdings Discounted Cash Flow (DCF) Analysis
A Discounted Cash Flow, or DCF, model takes estimates of the cash a business could generate in the future and discounts those amounts back to today to arrive at an implied value per share.
For BILL Holdings, the model used is a 2 Stage Free Cash Flow to Equity approach, based on cash flow projections expressed in US$. The latest twelve month free cash flow is around $320.6 million. Analyst inputs and extrapolated estimates point to projected free cash flow of about $828.2 million in 2035, with interim years such as 2026, 2028 and 2030 sitting between these two figures according to the supplied schedule.
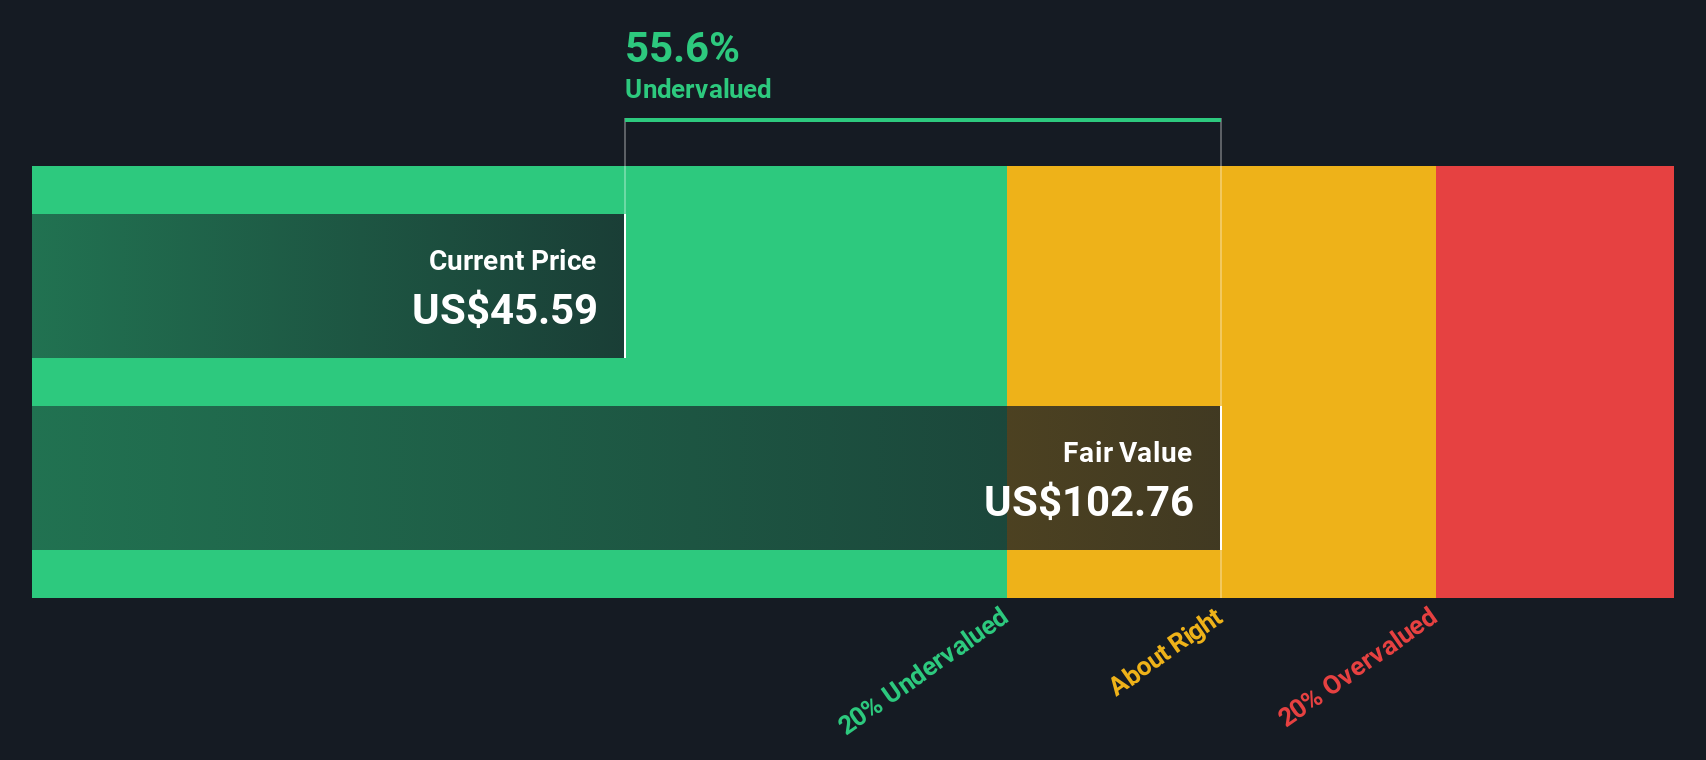
When all of those projected cash flows are discounted back using the DCF model, the resulting estimated intrinsic value is US$92.21 per share. Compared with the recent share price of US$54.48, the model implies the shares trade at a 40.9% discount, which indicates they screen as undervalued on this method alone.
Result: UNDERVALUED
Our Discounted Cash Flow (DCF) analysis suggests BILL Holdings is undervalued by 40.9%. Track this in your watchlist or portfolio, or discover 879 more undervalued stocks based on cash flows.
Approach 2: BILL Holdings Price vs Sales (P/S)
For companies where net income can be small or volatile, the P/S ratio is often a cleaner way to think about valuation because it compares the market value directly with the revenue the business is generating.
What counts as a reasonable P/S ratio usually reflects how much growth investors expect and how much risk they see. Higher expected growth or lower perceived risk can justify a higher multiple, while slower expected growth or higher risk tends to point to a lower, more conservative multiple.
BILL Holdings currently trades on a P/S of 3.64x. That sits below the Software industry average of 5.00x and also below the peer group average of 12.95x. On simple comparisons, the shares screen as cheaper than many alternatives in the space.
Simply Wall St’s Fair Ratio is a proprietary estimate of what P/S you might reasonably expect for BILL Holdings, based on factors like its growth profile, risk characteristics, profit margins, market value and its Software industry classification. This tends to be more tailored than using broad industry or peer averages, which can mix together companies with very different growth, risk and profitability.
For BILL Holdings, the Fair Ratio is 6.78x, which is higher than the current 3.64x P/S. On this basis, the shares appear to be trading below that Fair Ratio estimate.
Result: UNDERVALUED
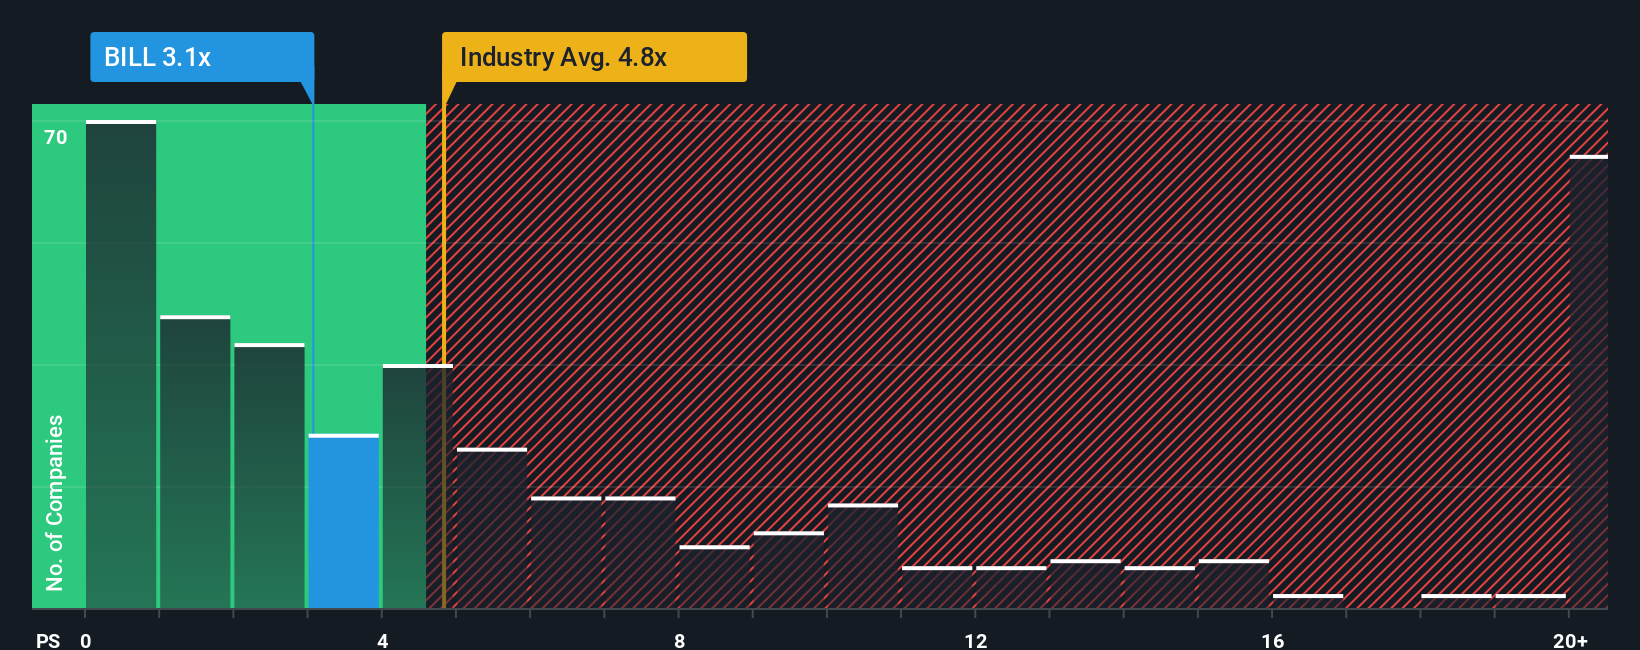
P/S ratios tell one story, but what if the real opportunity lies elsewhere? Discover 1444 companies where insiders are betting big on explosive growth.
Upgrade Your Decision Making: Choose your BILL Holdings Narrative
Earlier we mentioned that there is an even better way to understand valuation. On Simply Wall St’s Community page you can use Narratives, where you write your own story for BILL Holdings by setting assumptions for future revenue, earnings and margins. You then link that story to a financial forecast and fair value, and compare that fair value with the current price to decide whether the stock looks attractive or not. The system updates your Narrative as new earnings or news arrive. This is why some investors, looking at the same information, have uploaded Narratives that point to a fair value near the higher US$89 analyst target, while others, using more cautious assumptions closer to the US$42 target, arrive at a much lower fair value for the very same company.
Do you think there's more to the story for BILL Holdings? Head over to our Community to see what others are saying!
This article by Simply Wall St is general in nature. We provide commentary based on historical data and analyst forecasts only using an unbiased methodology and our articles are not intended to be financial advice. It does not constitute a recommendation to buy or sell any stock, and does not take account of your objectives, or your financial situation. We aim to bring you long-term focused analysis driven by fundamental data. Note that our analysis may not factor in the latest price-sensitive company announcements or qualitative material. Simply Wall St has no position in any stocks mentioned.