Is Booz Allen Hamilton (BAH) Pricing Reflect Its 36% Share Price Slide And DCF Upside Potential
Booz Allen Hamilton Holding Corporation Class A BAH | 0.00 |
- If you are wondering whether Booz Allen Hamilton Holding stock is offering value at current levels, a useful starting point is to look closely at what the recent share performance and fundamentals are actually showing.
- The stock last closed at US$76.28, with a 0.2% decline over 7 days, an 8.9% decline over 30 days, a 10.1% decline year to date and a 36.5% decline over the past year. This naturally raises questions about whether the risk and reward are now better balanced.
- Recent headlines around Booz Allen Hamilton Holding have focused on its role as a government and commercial consultant, and how contract activity, regulatory developments and sector sentiment may be influencing expectations for future work. This backdrop helps explain why the share price has been reassessed over the last year as investors react to changing perceptions of growth and risk.
- Simply Wall St currently assigns Booz Allen Hamilton Holding a valuation score of 5/6. This reflects how many checks it passes as undervalued. The next sections walk through what that means using different valuation methods, then finish with a way to think about valuation that goes beyond the numbers alone.
Approach 1: Booz Allen Hamilton Holding Discounted Cash Flow (DCF) Analysis
A Discounted Cash Flow, or DCF, model estimates what a stock could be worth by projecting the company’s future cash flows and discounting them back to today’s value. It is essentially asking what those future dollars are worth in today’s terms.
For Booz Allen Hamilton Holding, the model uses a 2 Stage Free Cash Flow to Equity approach. The latest twelve month Free Cash Flow is about $934.3 million. Analysts provide Free Cash Flow estimates for the next few years, and Simply Wall St then extends those out to a 10 year view, with projected Free Cash Flow in 2035 of about $1.2b, based on the supplied trajectory of forecasts and extrapolations.
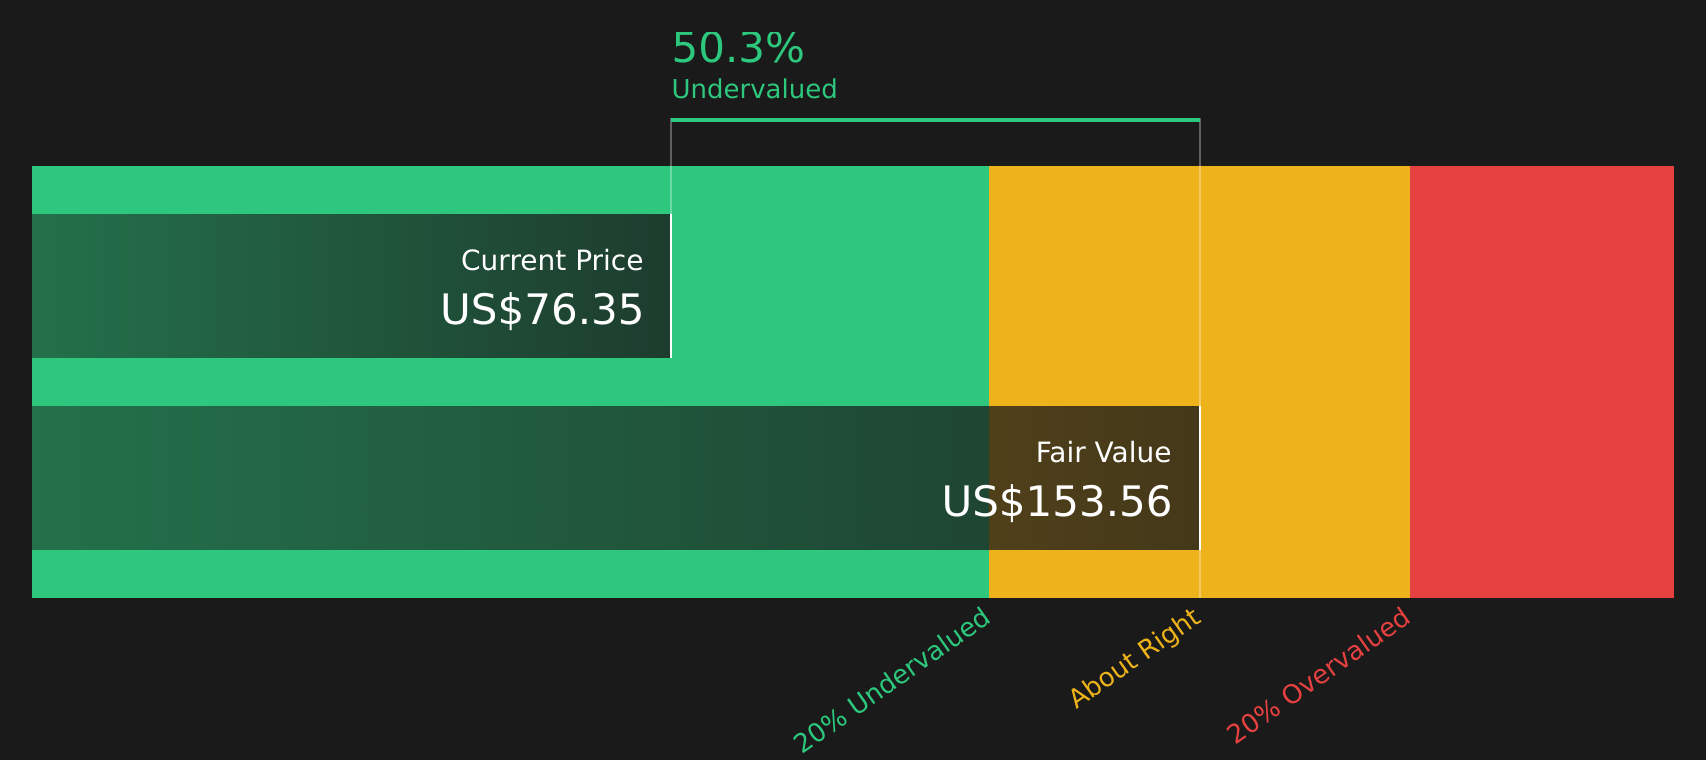
When all those projected cash flows are discounted back and combined, the DCF model arrives at an estimated intrinsic value of about US$157.62 per share. Compared with the recent share price of US$76.28, this implies the stock is trading at a 51.6% discount to that DCF estimate. This points to a wide gap between price and modelled value.
Result: UNDERVALUED
Our Discounted Cash Flow (DCF) analysis suggests Booz Allen Hamilton Holding is undervalued by 51.6%. Track this in your watchlist or portfolio, or discover 44 more high quality undervalued stocks.
Approach 2: Booz Allen Hamilton Holding Price vs Earnings
P/E is often the go to multiple for profitable companies because it links what you pay directly to the earnings the business is currently generating. It also gives a quick sense of how much optimism or caution is built into the share price.
Higher growth expectations and lower perceived risk usually support a higher P/E ratio, while slower growth expectations or higher uncertainty usually lead investors to pay a lower multiple. So the question is not whether a P/E is high or low in isolation, but whether it is high or low relative to what the business might realistically deliver and how risky those earnings are.
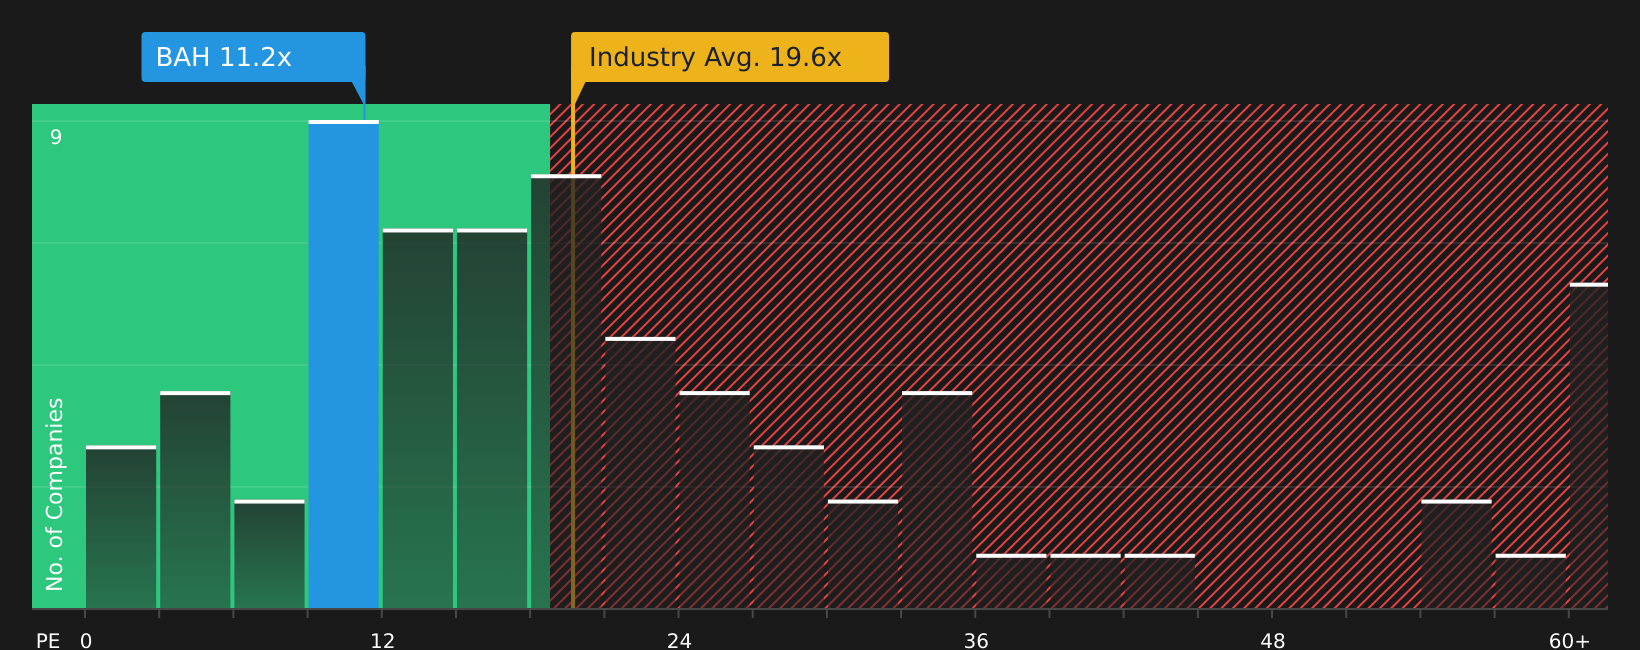
Booz Allen Hamilton Holding is currently trading on a P/E of 11.04x. That compares with a Professional Services industry average P/E of about 18.94x and a peer average of 31.53x. Simply Wall St also calculates a proprietary Fair Ratio of 16.35x for the stock, which reflects factors such as earnings growth, industry, profit margin, market cap and risk profile.
This Fair Ratio is more tailored than a simple comparison with peers or industry averages because it adjusts for the company’s specific earnings outlook, risk and profitability. Comparing 11.04x with the Fair Ratio of 16.35x suggests the stock is trading below that customised benchmark.
Result: UNDERVALUED
P/E ratios tell one story, but what if the real opportunity lies elsewhere? Start investing in legacies, not executives. Discover our 19 top founder-led companies.
Upgrade Your Decision Making: Choose your Booz Allen Hamilton Holding Narrative
Earlier it was mentioned that there is an even better way to understand valuation, so meet Narratives, a simple tool on Simply Wall St’s Community page that lets you connect your story about Booz Allen Hamilton Holding to a set of forecast numbers, link those forecasts to a Fair Value, compare that Fair Value with the current share price to help frame your own buy or sell decisions, and keep that view updated automatically as new information like earnings or contract news comes in. One investor might build a Narrative around a higher Fair Value closer to US$160 based on expectations for federal cyber work and AI focused contracts, while another might anchor on a lower Fair Value around US$80 to US$89 that reflects concerns about automation, contract risk and margins. Yet both are using the same shared framework to make their thinking clearer and more consistent.
Do you think there's more to the story for Booz Allen Hamilton Holding? Head over to our Community to see what others are saying!

This article by Simply Wall St is general in nature. We provide commentary based on historical data and analyst forecasts only using an unbiased methodology and our articles are not intended to be financial advice. It does not constitute a recommendation to buy or sell any stock, and does not take account of your objectives, or your financial situation. We aim to bring you long-term focused analysis driven by fundamental data. Note that our analysis may not factor in the latest price-sensitive company announcements or qualitative material. Simply Wall St has no position in any stocks mentioned.