Is Brookfield Infrastructure Partners (BIP) Pricing Reflecting Its DCF Gap And Resilient Assets Story
Brookfield Infrastructure Partners L.P. BIP | 36.51 | +0.44% |
- If you are wondering whether Brookfield Infrastructure Partners is attractively priced or not, you are in the right place.
- The units currently trade at US$35.14, with returns of 2.4% year to date and 13.0% over the last year. This may signal that investors are reassessing both the upside and the risks.
- Recent news coverage has focused on Brookfield Infrastructure Partners as a global owner and operator of essential assets. This can shape how investors think about its resilience and cash flow profile. Commentary has also highlighted its exposure across utilities, transport, energy and data infrastructure, factors that can influence how the market views its long term growth and risk mix.
- Our valuation model gives Brookfield Infrastructure Partners a 3 out of 6 score for potential undervaluation. Next we will look at traditional approaches like multiples and cash flow based methods, then finish with a way of thinking about value that can be even more useful for long term investors.
Approach 1: Brookfield Infrastructure Partners Discounted Cash Flow (DCF) Analysis
A Discounted Cash Flow, or DCF, model estimates what a business could be worth today by projecting its future cash flows and then discounting those back to a present value using a required return.
For Brookfield Infrastructure Partners, the model uses last twelve month Free Cash Flow of about $952.4 million as a starting point and applies a 2 Stage Free Cash Flow to Equity approach. Analysts provide explicit forecasts out to 2030, with projected Free Cash Flow of $5,573 million in that year. Simply Wall St then extrapolates estimates further out to 2035 to build a full 10 year cash flow path.
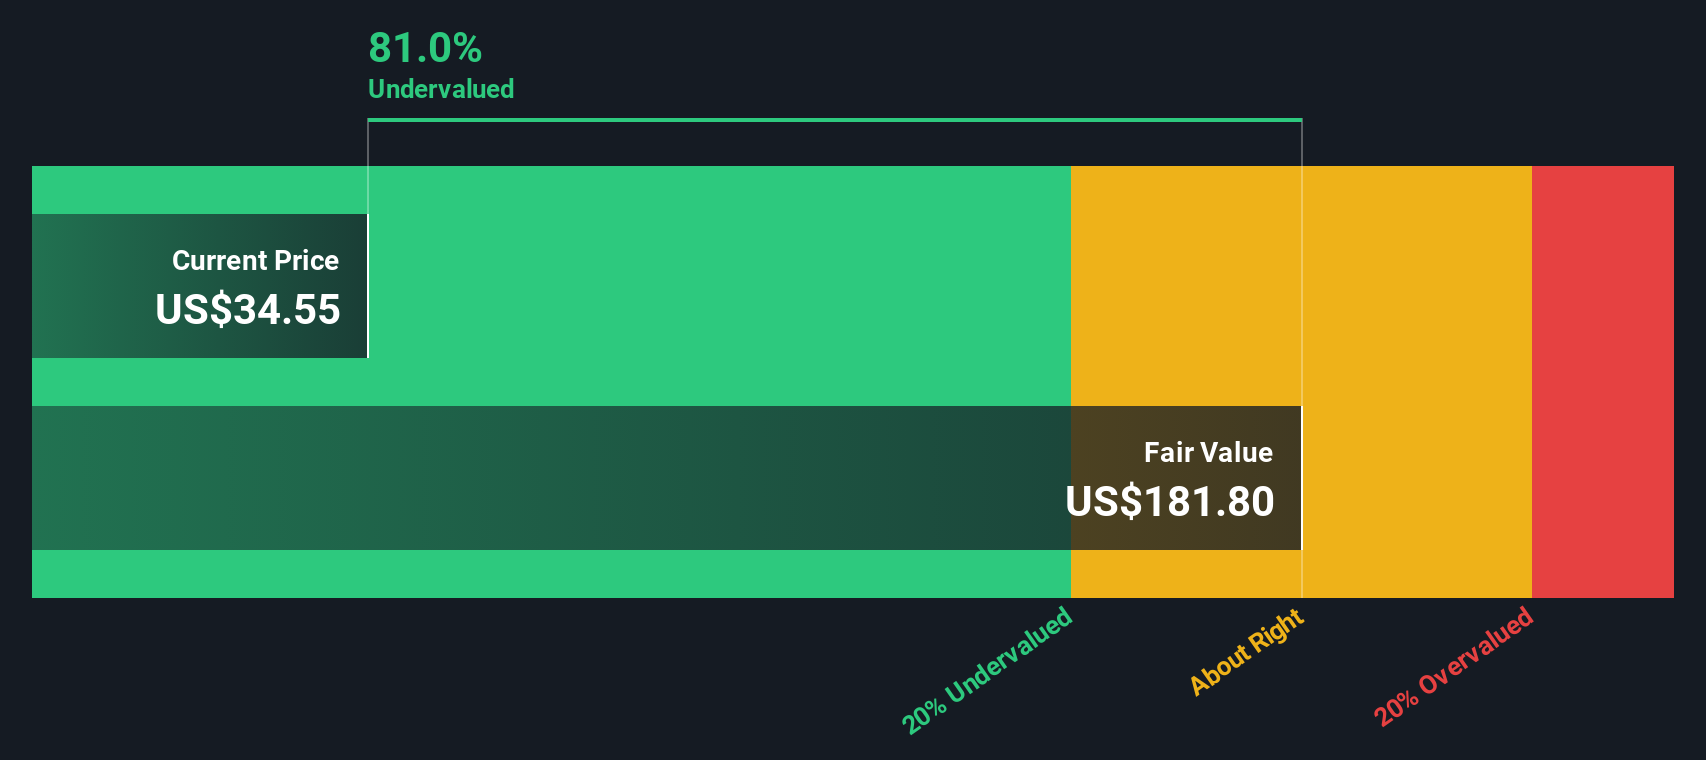
When all those projected cash flows are discounted back and combined with the terminal value, the DCF model arrives at an estimated intrinsic value of about $160.31 per unit. Compared with the current unit price of US$35.14, this implies the units are trading at a 78.1% discount to this DCF estimate. On this model alone, this points to meaningful potential undervaluation.
Result: UNDERVALUED
Our Discounted Cash Flow (DCF) analysis suggests Brookfield Infrastructure Partners is undervalued by 78.1%. Track this in your watchlist or portfolio, or discover 888 more undervalued stocks based on cash flows.
Approach 2: Brookfield Infrastructure Partners Price vs Earnings
For profitable companies, the P/E ratio is a useful anchor because it tells you how much you are paying for each dollar of current earnings. Investors typically accept a higher P/E when they expect stronger earnings growth or see lower risk, and a lower P/E when growth expectations are more modest or risks feel higher.
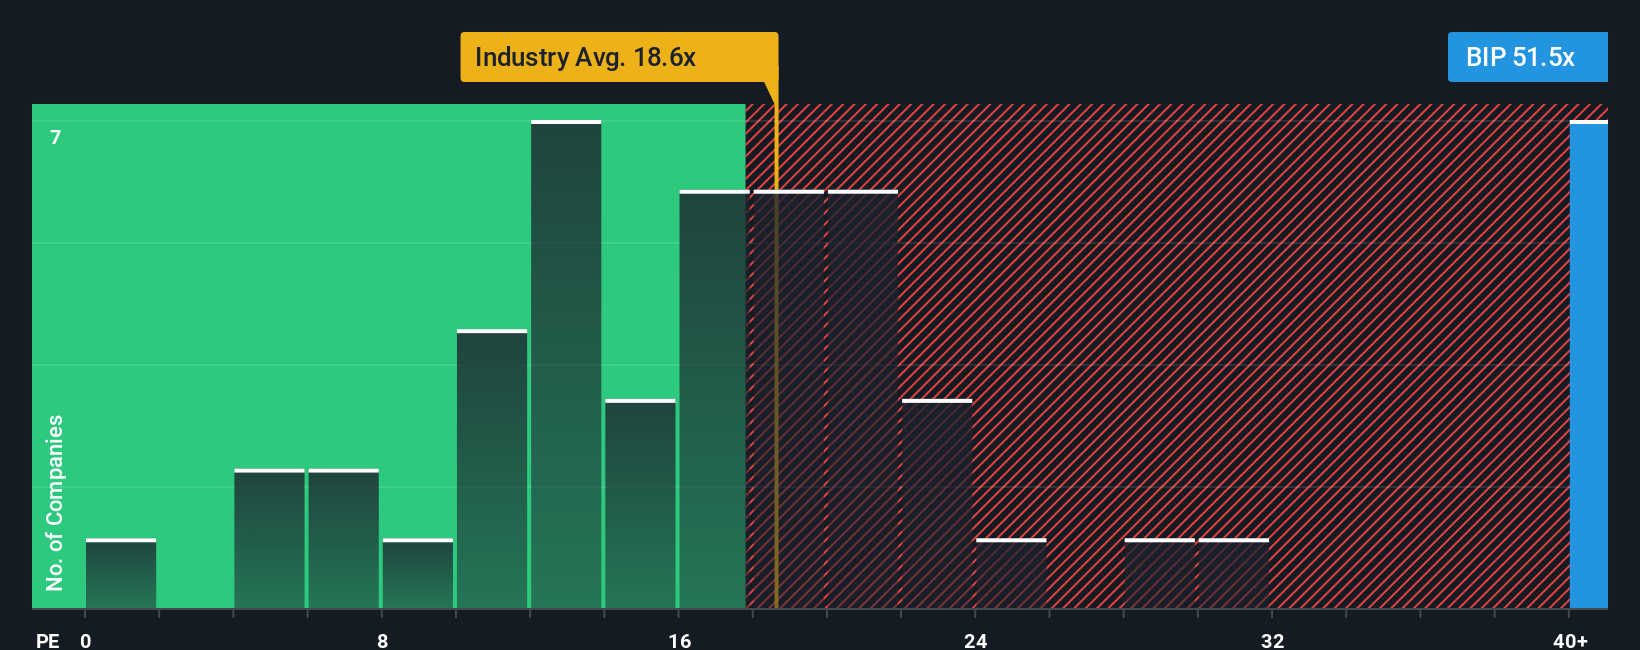
Brookfield Infrastructure Partners currently trades on a P/E of 50.18x. That is well above the Integrated Utilities industry average P/E of 18.91x and also above the peer group average of 22.27x. On simple comparisons, the units look expensive relative to both the wider industry and closest peers.
Simply Wall St also uses a proprietary “Fair Ratio” to estimate what a more tailored P/E might be, given the company’s earnings growth profile, industry, profit margins, market cap and risk factors. This Fair Ratio for Brookfield Infrastructure Partners is 40.85x, which aims to be more precise than broad industry or peer averages because it blends these company specific inputs. Comparing this Fair Ratio to the current P/E suggests the units trade above that tailored reference point, which points to potential overvaluation on this metric.
Result: OVERVALUED
P/E ratios tell one story, but what if the real opportunity lies elsewhere? Discover 1425 companies where insiders are betting big on explosive growth.
Upgrade Your Decision Making: Choose your Brookfield Infrastructure Partners Narrative
Earlier we mentioned that there is an even better way to understand valuation, so let us introduce you to Narratives, which simply means writing the story you believe about a company and tying that story directly to the numbers you use for fair value, revenue, earnings and margins.
On Simply Wall St, Narratives live in the Community page and give you an easy way to connect Brookfield Infrastructure Partners real world story to a clear financial forecast, then to a fair value you can compare with the current price to help you decide whether the gap between the two looks interesting enough to consider buying or selling.
Because Narratives on the platform are used by millions of investors and update automatically when fresh news, earnings or other data arrive, you always see how that story flows through to estimates and fair value rather than trying to mentally adjust spreadsheets each time something changes.
For example, one Brookfield Infrastructure Partners Narrative might assume a very optimistic fair value while another assumes a much lower fair value, which shows how investors with different expectations about future growth, risk and profitability can look at the same company and reach very different conclusions about what the units are worth today.
Do you think there's more to the story for Brookfield Infrastructure Partners? Head over to our Community to see what others are saying!

This article by Simply Wall St is general in nature. We provide commentary based on historical data and analyst forecasts only using an unbiased methodology and our articles are not intended to be financial advice. It does not constitute a recommendation to buy or sell any stock, and does not take account of your objectives, or your financial situation. We aim to bring you long-term focused analysis driven by fundamental data. Note that our analysis may not factor in the latest price-sensitive company announcements or qualitative material. Simply Wall St has no position in any stocks mentioned.