Is Brunswick (BC) Still Attractively Priced After A 34% One Year Share Price Gain
Brunswick Corporation BC | 78.99 | +2.28% |
- If you are wondering whether Brunswick's share price still offers value after a strong run, the next sections will walk through what the current market price might be implying about the business.
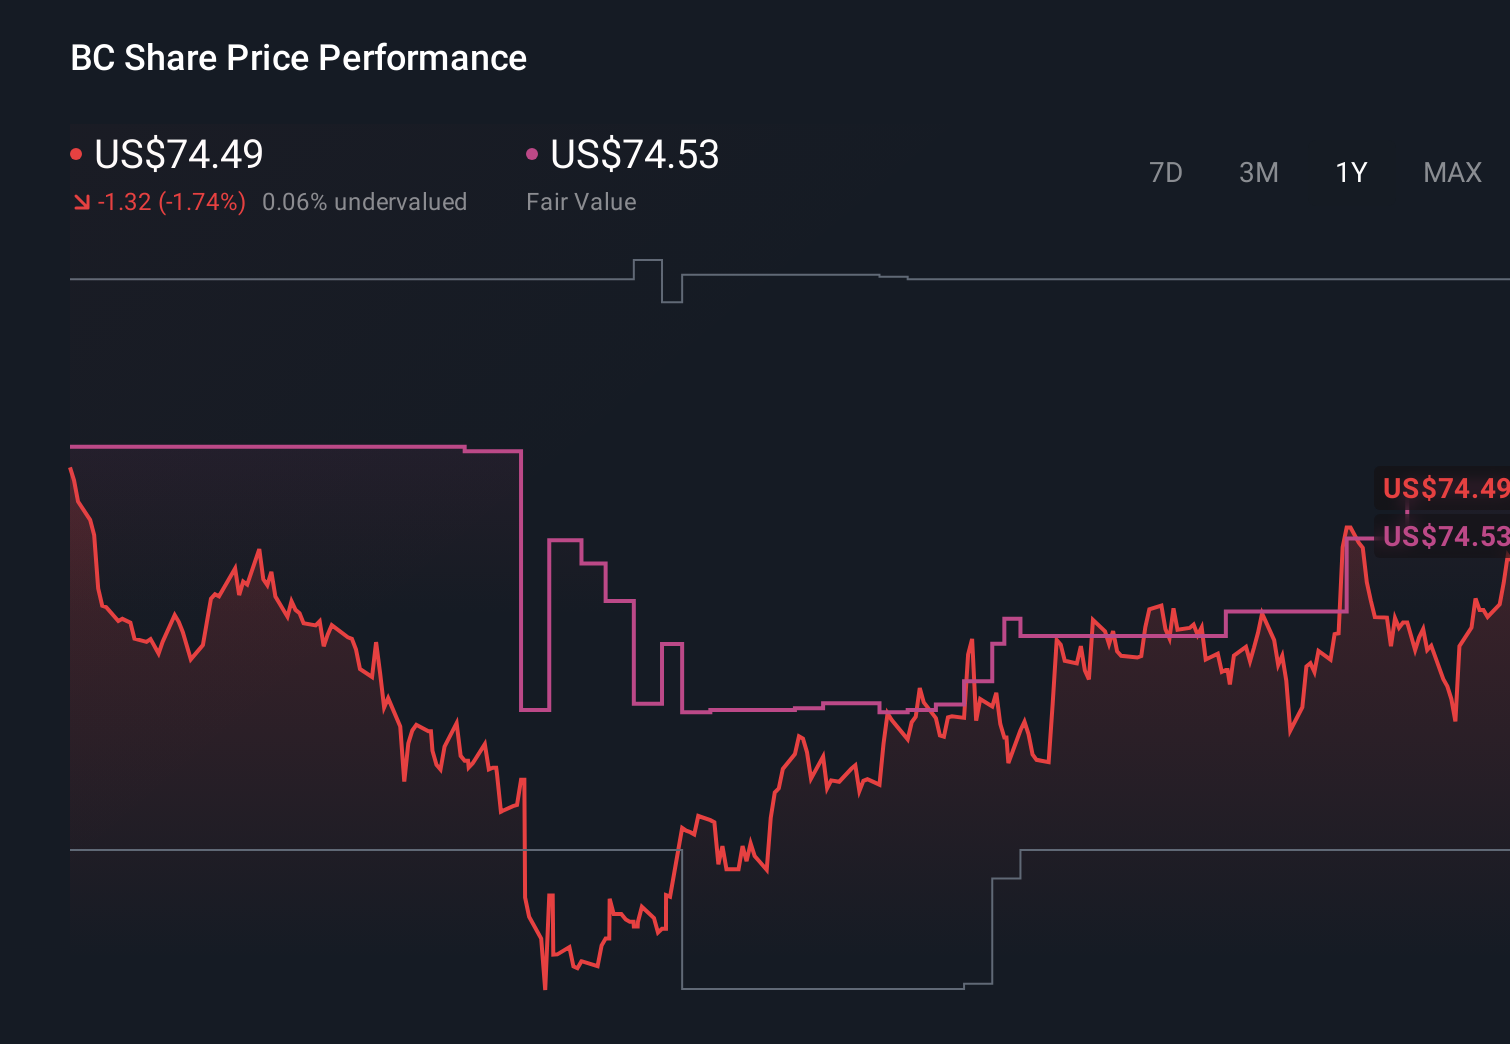
- The stock last closed at US$86.69, with returns of 7.5% over 7 days, 3.6% over 30 days, 14.2% year to date, 34.4% over 1 year, 7.3% over 3 years and 5.6% over 5 years. This hints that expectations and perceived risk have shifted over different time frames.
- Recent coverage has focused on Brunswick as a key player in consumer durables and leisure products, with investors paying attention to how its brand portfolio and end market exposure fit into their portfolios. This context helps frame the current share price moves as the market reassesses how it values companies linked to discretionary spending and recreation.
- On our valuation checks, Brunswick scores 3 out of 6. Next we will look at what different valuation approaches say about the stock, before finishing with a more complete way to think about value that goes beyond the headline numbers.
Approach 1: Brunswick Discounted Cash Flow (DCF) Analysis
A Discounted Cash Flow, or DCF, model estimates what a business could be worth today by projecting its future cash flows and discounting them back to the present. It is essentially asking what the stream of future cash that might come to shareholders is worth in today's dollars.
For Brunswick, the model used is a 2 Stage Free Cash Flow to Equity approach, based on cash flow projections rather than earnings. The latest twelve month free cash flow is about $365.7 million. Analyst inputs and extrapolated estimates from Simply Wall St project free cash flow rising to around $760.6 million in 2035, with specific points such as $451.8 million in 2026 and $522 million in 2028 included in the path.
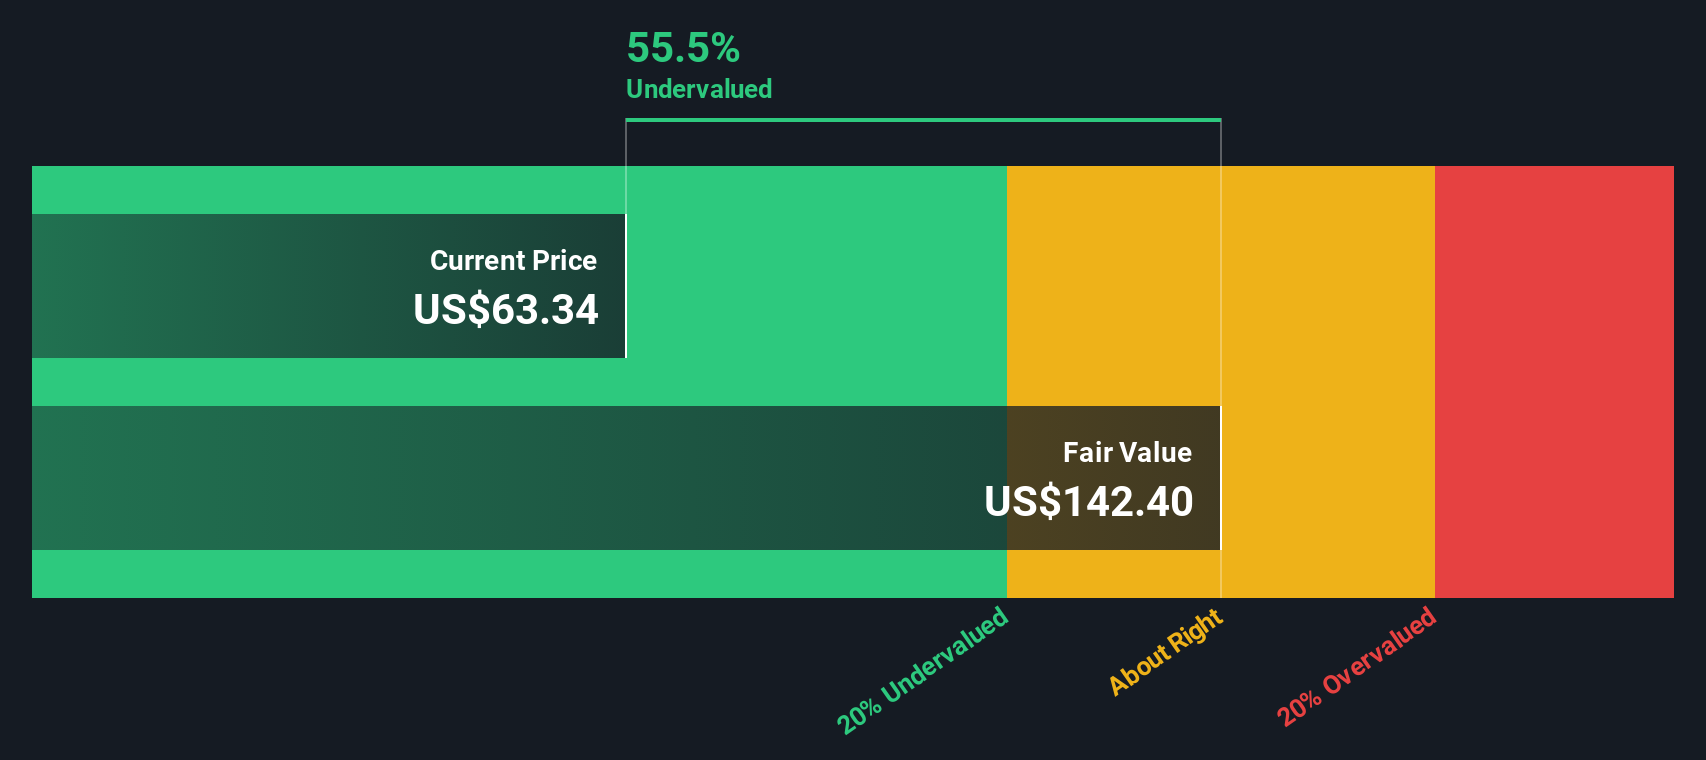
Pulling all of these projected cash flows together, the model arrives at an estimated intrinsic value of about $187.04 per share, compared with the current share price of $86.69. On this basis, the DCF output suggests the stock is 53.7% undervalued.
Result: UNDERVALUED
Our Discounted Cash Flow (DCF) analysis suggests Brunswick is undervalued by 53.7%. Track this in your watchlist or portfolio, or discover 861 more undervalued stocks based on cash flows.
Approach 2: Brunswick Price vs Sales
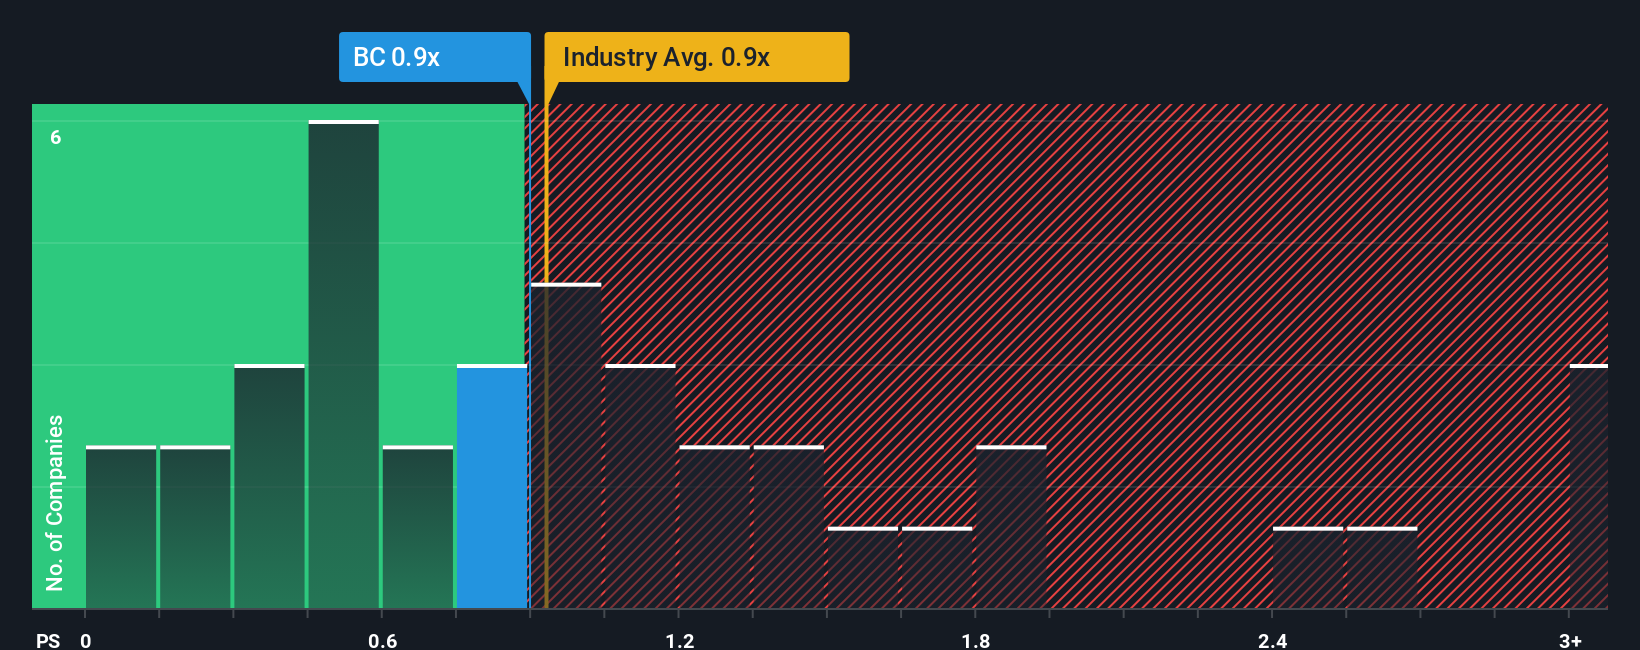
For companies where sales are a key driver and earnings can be noisy, the P/S ratio is a useful way to compare what investors are paying for each dollar of revenue. It sidesteps short term accounting swings in profit and focuses on the top line.
What investors see as a "normal" P/S at any point tends to reflect expectations for future growth and the perceived risk of those sales. Higher expected growth or lower risk can justify a higher multiple, while slower growth or higher risk usually points to a lower, more cautious multiple.
Brunswick currently trades on a P/S of 1.05x. That sits close to the Leisure industry average of 0.96x and below the peer group average of 1.79x. Simply Wall St's Fair Ratio for Brunswick, at 0.90x, is a proprietary estimate of what P/S might make sense given its growth profile, industry, profit margins, market cap and company specific risks.
The Fair Ratio goes a step beyond simple peer or industry comparisons by tailoring the multiple to Brunswick's own characteristics rather than relying on broad group averages. Compared with the current 1.05x P/S, the 0.90x Fair Ratio points to the shares screening as slightly expensive on this metric.
Result: OVERVALUED
P/S ratios tell one story, but what if the real opportunity lies elsewhere? Discover 1433 companies where insiders are betting big on explosive growth.
Upgrade Your Decision Making: Choose your Brunswick Narrative
Earlier we mentioned that there is an even better way to understand valuation, so let us introduce you to Narratives, a simple way to connect your view of Brunswick with the numbers behind it. A Narrative is your story for the company, where you set assumptions for future revenue, earnings and margins, and link that story to a financial forecast and then to a fair value estimate. On Simply Wall St, millions of investors use Narratives on the Community page to quickly compare their own fair value to the current share price and decide whether the stock looks attractive or stretched. Because Narratives update automatically when new information such as news or earnings arrives, your fair value stays aligned with the latest data without you rebuilding a model each time. For example, one Brunswick Narrative on the Community page might reflect a very cautious view with low revenue growth and tight margins, while another might assume stronger growth and healthier profitability, leading to very different fair values and decisions.
Do you think there's more to the story for Brunswick? Head over to our Community to see what others are saying!
This article by Simply Wall St is general in nature. We provide commentary based on historical data and analyst forecasts only using an unbiased methodology and our articles are not intended to be financial advice. It does not constitute a recommendation to buy or sell any stock, and does not take account of your objectives, or your financial situation. We aim to bring you long-term focused analysis driven by fundamental data. Note that our analysis may not factor in the latest price-sensitive company announcements or qualitative material. Simply Wall St has no position in any stocks mentioned.