Is Caesars Entertainment (CZR) Pricing Reflect Its Value After Prolonged Share Price Weakness
Caesars Entertainment, Inc. CZR | 26.53 | -0.08% |
- If you are wondering whether Caesars Entertainment's share price reflects its underlying value, this article walks through the key numbers in a clear, practical way.
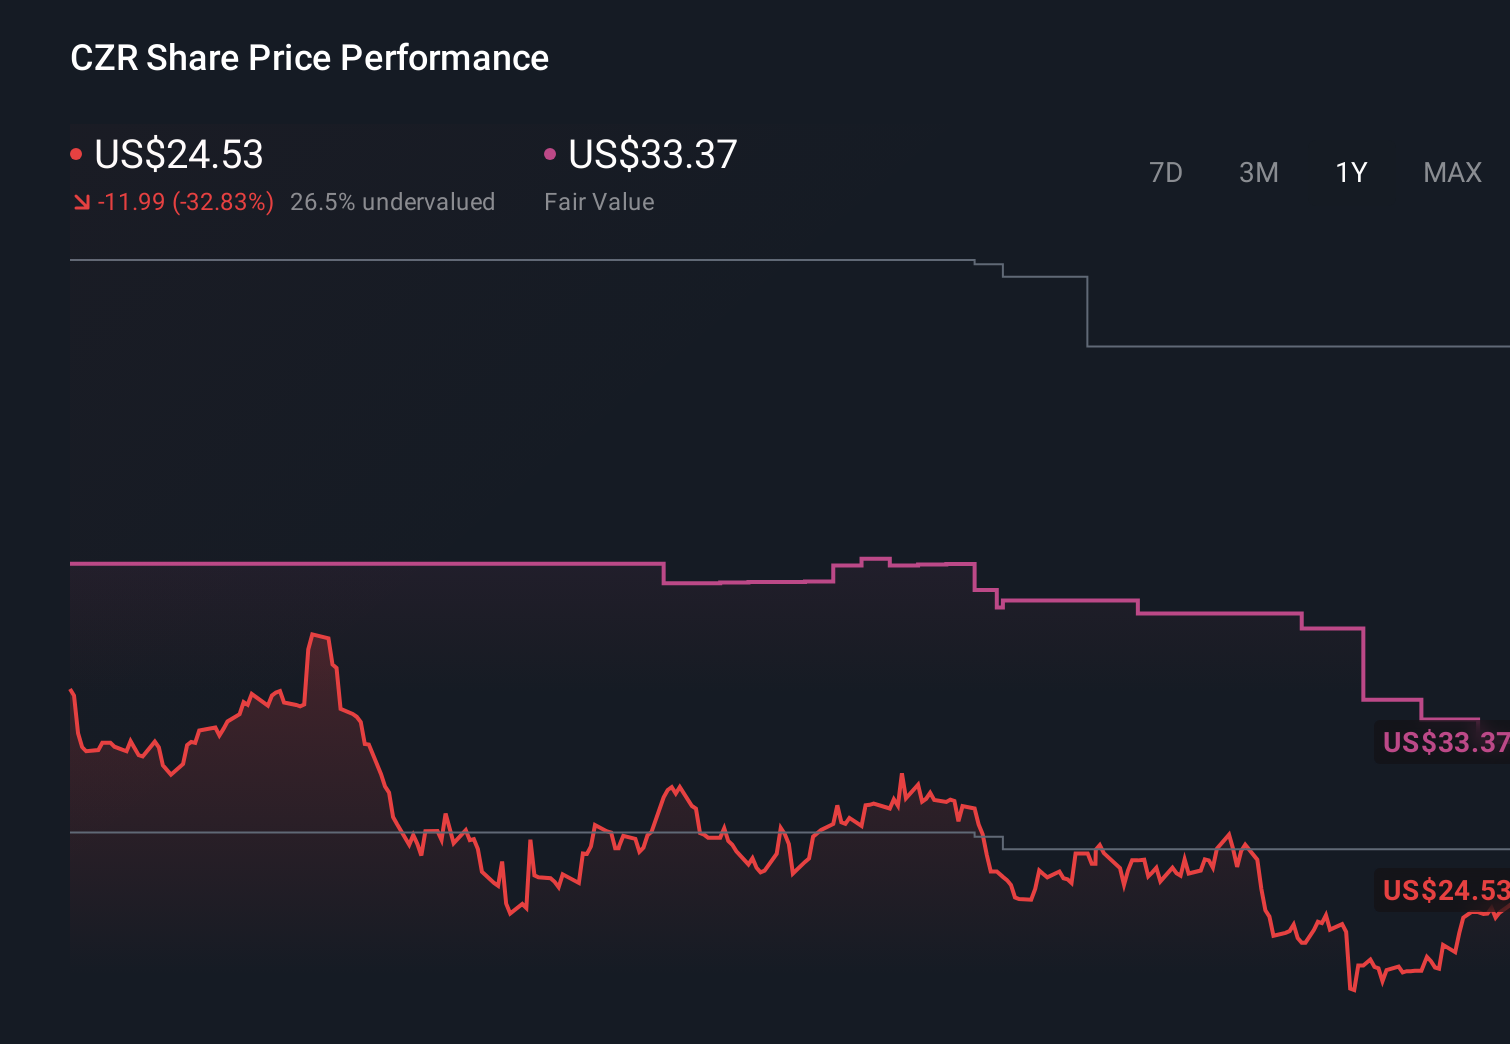
- At a last close of US$20.56, the stock has seen a 4.7% decline over the past week, a 12.7% decline over the last month, and is down 12.7% year to date and 43.1% over the past year, with a 62.6% decline over three years and 74.8% over five years.
- Recent coverage around Caesars has focused on how the business is managing its operations and capital structure, as well as market sentiment toward the broader US consumer services space. These themes help set the scene for how the share price has moved and why investors are now paying close attention to valuation.
- On Simply Wall St's 6 point valuation framework, Caesars Entertainment scores a 5 out of 6. We will look at what that means through different valuation methods before finishing with a way to put these numbers into a bigger picture.
Approach 1: Caesars Entertainment Discounted Cash Flow (DCF) Analysis
A Discounted Cash Flow, or DCF, model takes Caesars Entertainment’s expected future cash flows and discounts them back to what they might be worth in today’s dollars. It is essentially asking what those future cash flows could be worth if you had them now.
Simply Wall St uses a 2 Stage Free Cash Flow to Equity model here. Caesars’ latest twelve month free cash flow is about $145.9 million. Analysts provide explicit forecasts out to 2027, where free cash flow is projected at $1.1b, and the platform then extends those projections out to 2035 using its own growth assumptions.
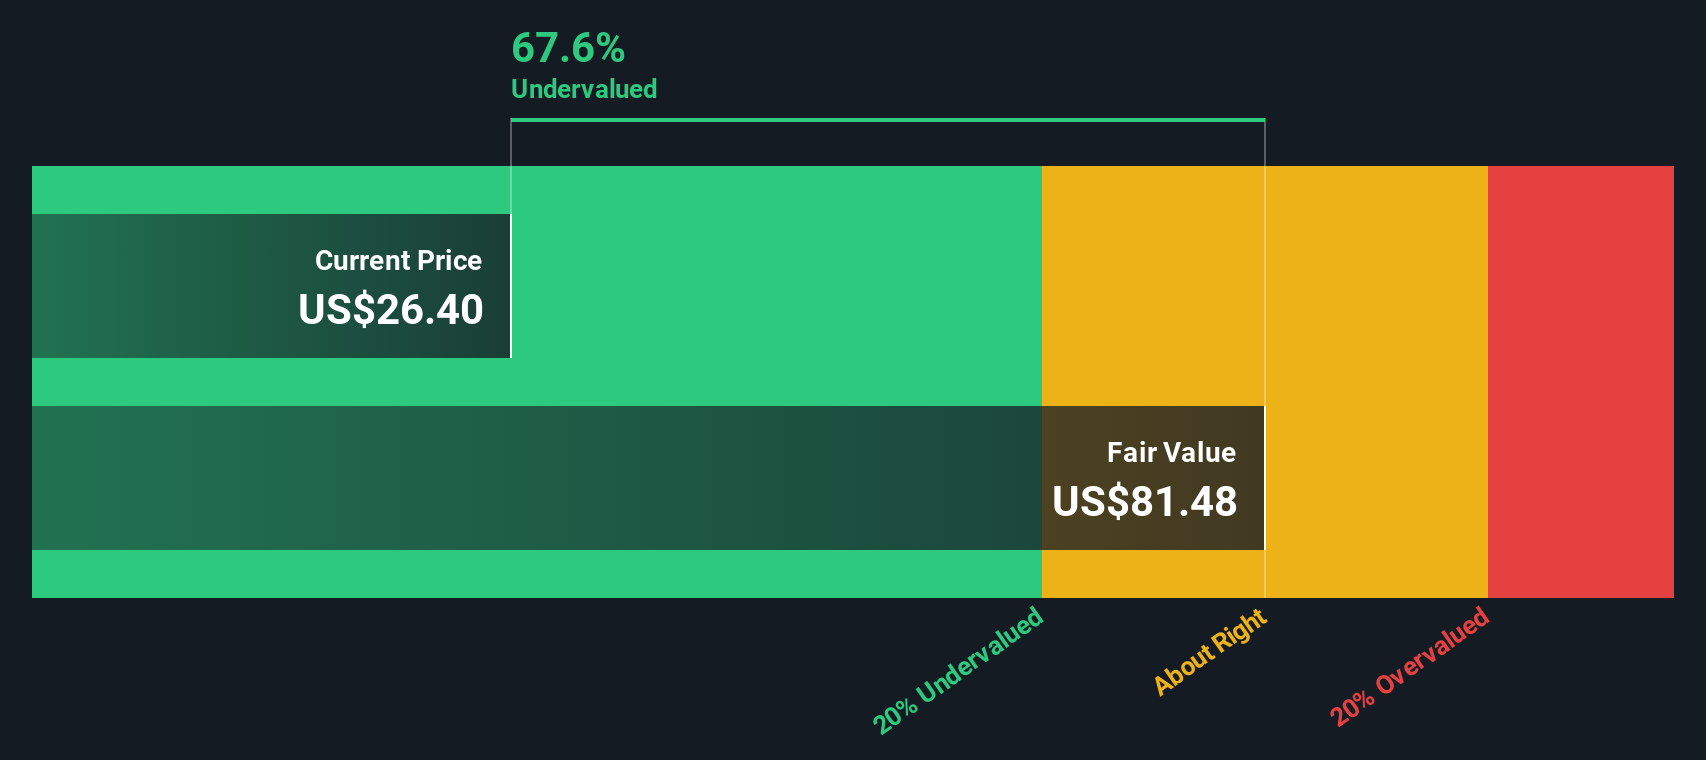
When all those future free cash flows are discounted back to today, the DCF model arrives at an estimated intrinsic value of about $60.31 per share for Caesars Entertainment, compared with the recent share price of $20.56. That implied 65.9% discount indicates that, on this model alone, the shares are screening as significantly undervalued.
Result: UNDERVALUED
Our Discounted Cash Flow (DCF) analysis suggests Caesars Entertainment is undervalued by 65.9%. Track this in your watchlist or portfolio, or discover 873 more undervalued stocks based on cash flows.
Approach 2: Caesars Entertainment Price vs Sales (P/S)
For companies where earnings can be uneven, the P/S ratio is often a useful cross check because it compares the value the market is putting on the business with the revenue it is generating, rather than its bottom line profit.
What investors usually look for is whether a company’s P/S ratio makes sense given its growth outlook and risk profile. Higher expected growth and lower perceived risk tend to justify a higher “normal” or “fair” multiple, while slower growth or higher risk usually point to a lower one.
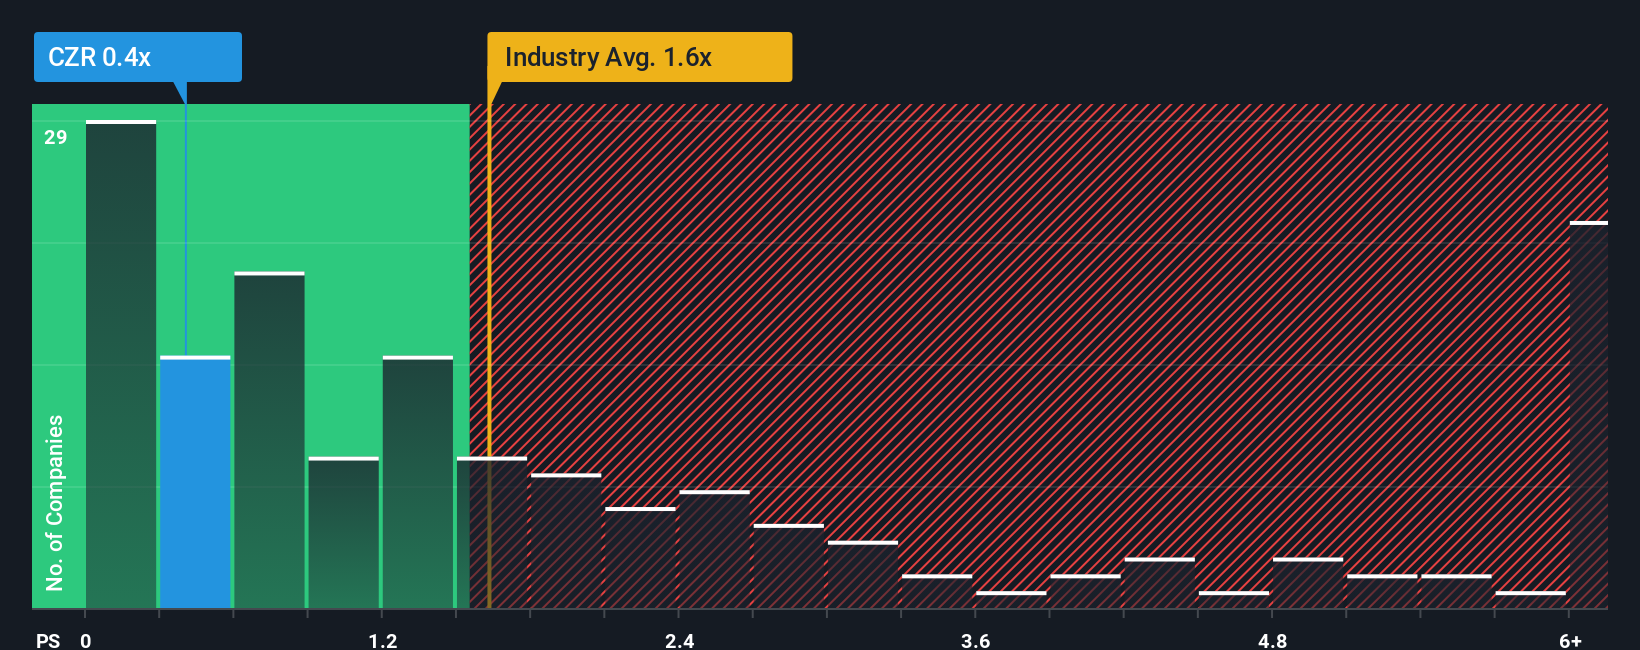
Caesars Entertainment currently trades on a P/S ratio of 0.37x. That sits below the Hospitality industry average of 1.58x and the peer group average of 2.29x. Simply Wall St also calculates a proprietary “Fair Ratio” for Caesars of 1.41x, which is the P/S multiple it might typically warrant once factors like earnings growth, industry, profit margin, market cap and company specific risks are taken into account.
This Fair Ratio can be more informative than a simple comparison with peers or the industry because it adjusts for what makes Caesars different rather than assuming all companies should trade on the same multiple. Since the current 0.37x P/S is below the 1.41x Fair Ratio, the shares screen as undervalued on this basis.
Result: UNDERVALUED
P/S ratios tell one story, but what if the real opportunity lies elsewhere? Discover 1426 companies where insiders are betting big on explosive growth.
Upgrade Your Decision Making: Choose your Caesars Entertainment Narrative
Earlier we mentioned that there is an even better way to understand valuation, so let us introduce you to Narratives, which give you a clear story behind the numbers such as your fair value estimate and your expectations for Caesars Entertainment’s future revenue, earnings and margins.
A Narrative links what you believe about the business, for example how Caesars might manage its properties, digital offerings or balance sheet, to a structured financial forecast and then to a fair value that you can compare with the current share price.
On Simply Wall St, Narratives live in the Community page, where millions of investors can set their own assumptions, see a calculated fair value, and quickly judge whether that suggests the stock could be trading above or below their view of worth.
Narratives update automatically when new information such as earnings releases or major news is added. You might see one Caesars Narrative that assumes relatively cautious revenue growth and a low fair value estimate, alongside another that assumes stronger margins and a higher fair value. This shows how different investors can use the same tool to reach very different conclusions.
Do you think there's more to the story for Caesars Entertainment? Head over to our Community to see what others are saying!
This article by Simply Wall St is general in nature. We provide commentary based on historical data and analyst forecasts only using an unbiased methodology and our articles are not intended to be financial advice. It does not constitute a recommendation to buy or sell any stock, and does not take account of your objectives, or your financial situation. We aim to bring you long-term focused analysis driven by fundamental data. Note that our analysis may not factor in the latest price-sensitive company announcements or qualitative material. Simply Wall St has no position in any stocks mentioned.