Is Carrier Global (CARR) Now Attractive After Strong Year To Date Share Price Gains?
Carrier Global Corp. CARR | 0.00 |
- Wondering if Carrier Global at around US$68.54 is offering fair value or a potential mispricing opportunity? This article breaks down what the current share price might be telling you.
- The stock has recently moved, with returns of 7.4% over the last week, 6.8% over the last month, and 28.1% year to date. The return over the past year is down 2.6%, and up 56.6% over three years and 60.3% over five years.
- Recent coverage around Carrier Global has focused on its role in the building and HVAC equipment space, including how its product portfolio positions it in areas like climate control and building efficiency. This kind of attention can influence how investors think about both the growth opportunity and the risks attached to the current price.
- On Simply Wall St's 6 point valuation framework, Carrier Global scores 3 out of 6. The rest of this article will break down what that implies across different valuation methods and then finish with a perspective that can help you interpret those models in a more complete way.
Approach 1: Carrier Global Discounted Cash Flow (DCF) Analysis
A Discounted Cash Flow model takes estimates of a company’s future cash flows and discounts them back to today’s dollars, aiming to approximate what the business might be worth right now.
For Carrier Global, the latest twelve month Free Cash Flow is about US$1.63b. Analysts provide explicit forecasts for several years, and beyond that, Simply Wall St extrapolates the path of Free Cash Flow. In this model, Carrier Global’s Free Cash Flow projection for 2030 is US$4.41b, with intermediate annual figures stepping up between those points based on the supplied estimates and extensions.
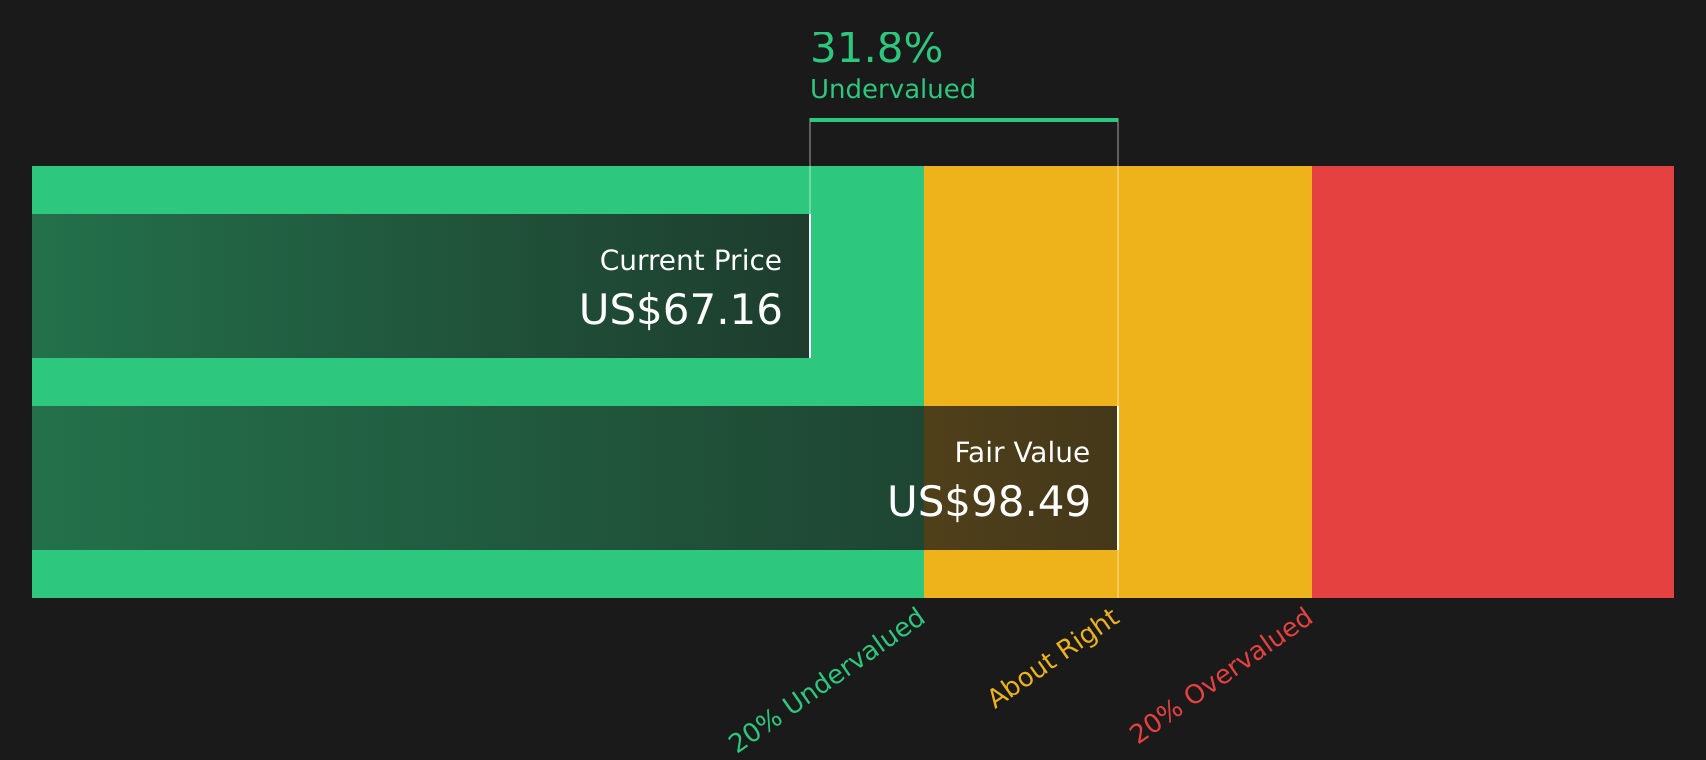
Putting all those projected cash flows into the 2 Stage Free Cash Flow to Equity model results in an estimated intrinsic value of US$98.33 per share. Compared with the recent share price of about US$68.54, the model implies the stock is trading at roughly a 30.3% discount. This suggests that, on this DCF view, the shares may be undervalued relative to the model’s estimate of intrinsic value.
Result: UNDERVALUED
Our Discounted Cash Flow (DCF) analysis suggests Carrier Global is undervalued by 30.3%. Track this in your watchlist or portfolio, or discover 47 more high quality undervalued stocks.
Approach 2: Carrier Global Price vs Earnings
For profitable companies, the P/E ratio is a useful way to relate what you pay for the stock to the earnings the business is currently generating. You can think of it as the market’s snapshot of how much it is willing to pay for each dollar of earnings.
What counts as a “normal” or “fair” P/E depends on how investors view the company’s growth potential and risk. Higher expected growth or lower perceived risk can support a higher P/E, while slower growth or higher risk tends to justify a lower one.
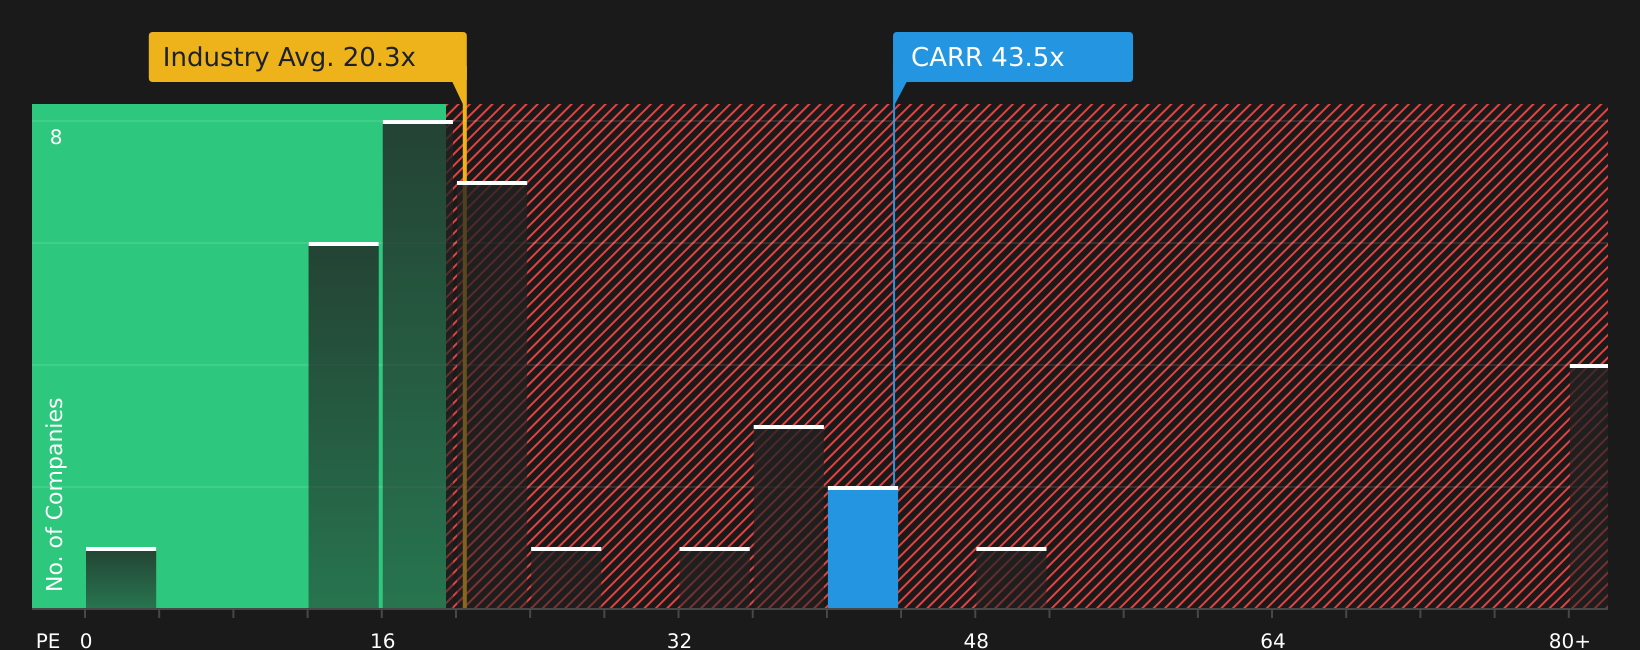
Carrier Global currently trades on a P/E of about 44.41x. This is above the Building industry average of about 20.22x, yet below the peer group average of roughly 58.12x. Simply Wall St’s Fair Ratio for Carrier Global is 38.64x, which is its proprietary view of what the P/E “should” be after accounting for factors like earnings growth, profit margins, industry, market cap and specific risks.
The Fair Ratio aims to be more tailored than a simple comparison with peers or the industry, because it adjusts for those company specific drivers rather than assuming all stocks deserve similar multiples.
With the actual P/E of 44.41x above the Fair Ratio of 38.64x, the stock screens as somewhat expensive on this metric.
Result: OVERVALUED
P/E ratios tell one story, but what if the real opportunity lies elsewhere? Start investing in legacies, not executives. Discover our 21 top founder-led companies.
Upgrade Your Decision Making: Choose your Carrier Global Narrative
Earlier it was mentioned that there is an even better way to understand valuation. Narratives let you attach a clear story about Carrier Global, including your assumptions for future revenue, earnings and margins, to a financial forecast that links through to a Fair Value you can compare with the current share price. You can then consider how that gap might inform your buy or sell timing and watch your view update automatically on Simply Wall St’s Community page as fresh news or earnings arrive, whether you lean closer to a bullish Fair Value around US$89.13 or a more cautious view nearer US$55.00.
For Carrier Global however, we’ll make it really easy for you with previews of two leading Carrier Global Narratives:
On Simply Wall St, these narratives sit alongside the DCF and multiples work you have already seen and give you a structured bullish and bearish story, with explicit assumptions for revenue, margins, P/E and discount rates. That way you can see which set of assumptions feels closer to your own view before you act.
Here is how the current bullish and bearish Carrier Global narratives line up.
Fair value: US$75.51 per share
Implied discount to this fair value: about 9.2% relative to the recent US$68.54 share price
Analyst revenue growth assumption: about 4.99% a year
- Frames Carrier Global as a beneficiary of demand for climate and energy efficiency solutions, including data center cooling, aftermarket services and European HVAC trends, with the Viessmann acquisition supporting revenue mix and profitability.
- Builds a forecast where analysts expect revenue to reach about US$25.3b and earnings about US$2.7b by 2029, with profit margins rising from 5.9% to 10.6% and the P/E easing to 27.5x using a 9.11% discount rate.
- Highlights risks around weaker regions, tariff exposure, currency movements and lower margin European operations, and encourages you to test whether those assumptions feel reasonable before accepting the US$75.51 fair value.
Fair value: US$55.00 per share
Implied premium to this fair value: about 24.6% relative to the recent US$68.54 share price
Bearish revenue growth assumption: about 3.35% a year
- Focuses on concentration risk in data center cooling customers, soft residential demand in Europe and other pockets of the portfolio, and the effect this could have on Commercial HVAC revenue and margins if project timing or unit volumes remain subdued.
- Builds a scenario where revenue grows more slowly to about US$24.4b by 2029, earnings reach about US$3.0b, margins increase to 12.3% and the stock trades on an 18.2x P/E with a 9.05% discount rate, which supports a US$55.00 fair value.
- Accepts that data center, electrification and aftermarket themes could still surprise positively, but treats them as upside risks to a cautious base case where today’s price sits above what the bearish cohort views as fair.
Both narratives use the same company facts but tell different stories about how much of Carrier Global's potential is already reflected in the current share price. Your task as an investor is to decide which story, or which mix of the two, best fits your expectations for revenue growth, margin progress and the P/E you think the stock could justify over time.
If you want to pressure test these views against your own expectations for Carrier Global's earnings path, margin profile and risk factors, the simplest next step is to review the full narrative breakdowns side by side and then adjust the assumptions to see how your fair value moves.
To see how these results tie into long-term growth, risks, and valuation, check out the full range of community narratives for Carrier Global on Simply Wall St. Add the company to your watchlist or portfolio so you'll be alerted when the story evolves.
Do you think there's more to the story for Carrier Global? Head over to our Community to see what others are saying!

This article by Simply Wall St is general in nature. We provide commentary based on historical data and analyst forecasts only using an unbiased methodology and our articles are not intended to be financial advice. It does not constitute a recommendation to buy or sell any stock, and does not take account of your objectives, or your financial situation. We aim to bring you long-term focused analysis driven by fundamental data. Note that our analysis may not factor in the latest price-sensitive company announcements or qualitative material. Simply Wall St has no position in any stocks mentioned.