

Is CBL & Associates Properties (CBL) Fully Valued On Higher Revenue And Updated Guidance?
CBL & Associates Properties, Inc. CBL | 0.00 |
CBL & Associates Properties (CBL) is back on investor radars after reporting higher second quarter and first half 2026 revenue and net income, alongside fresh full year earnings guidance and a reaffirmed quarterly dividend.
Despite a softer 1 day share price return that declined 1.5% and a 7 day share price return that declined 4.7%, CBL & Associates Properties has a 30 day share price return of 6.4% and a year to date share price return of 50.8%, alongside a 1 year total shareholder return of 105.5% and a 3 year total shareholder return of 214.3%. This points to strong momentum around the recent earnings, guidance and dividend updates.
If CBL & Associates Properties has you thinking about where else strong multi year returns might be forming, it could be worth scanning 19 top founder-led companies
After a sharp move higher in CBL & Associates Properties this year, the tougher call now is whether to accept today’s price after the fresh earnings and guidance, or hold out for a pullback before committing more capital.
Preferred P/E of 8.1x: Is it justified?
For CBL & Associates Properties, the headline number is its P/E of 8.1x at a last close of $55.70. That sits between a relatively low market multiple and a higher peer and industry range, which raises fair questions about how the stock is being priced.
The P/E multiple compares the current share price with earnings per share and is a common way investors think about what they are paying for current profits. For a retail focused REIT like CBL & Associates Properties, this can reflect how the market weighs its earnings profile, debt load and property portfolio against other income producing real estate companies.
There are a few cross currents here. On one hand, CBL & Associates Properties trades on a P/E of 8.1x that is below the wider US market P/E of 19.3x, which points to a lower price tag on current earnings than the market average. On the other hand, that same 8.1x sits above an estimated fair P/E of 7x, which suggests the multiple could be ahead of where a regression based fair value level might sit. Against that, the P/E remains well below the US Retail REITs industry average of 27.3x and a peer average of 58.1x, which are far higher reference points and underline how differently profits are being valued across the group.
Result: Price-to-Earnings of 8.1x (ABOUT RIGHT)
However, CBL & Associates Properties still faces risks related to its recent sharp share price gain and annual net income, which moved 98.1% lower.
Another view on CBL & Associates Properties using cash flows
The P/E of 8.1x for CBL & Associates Properties looks roughly in line with its recent share price run, but the SWS DCF model tells a different story. It points to a future cash flow value of $44.04 per share versus the current $55.70, which implies the stock is trading above that estimate. The question for you is which signal carries more weight right now.
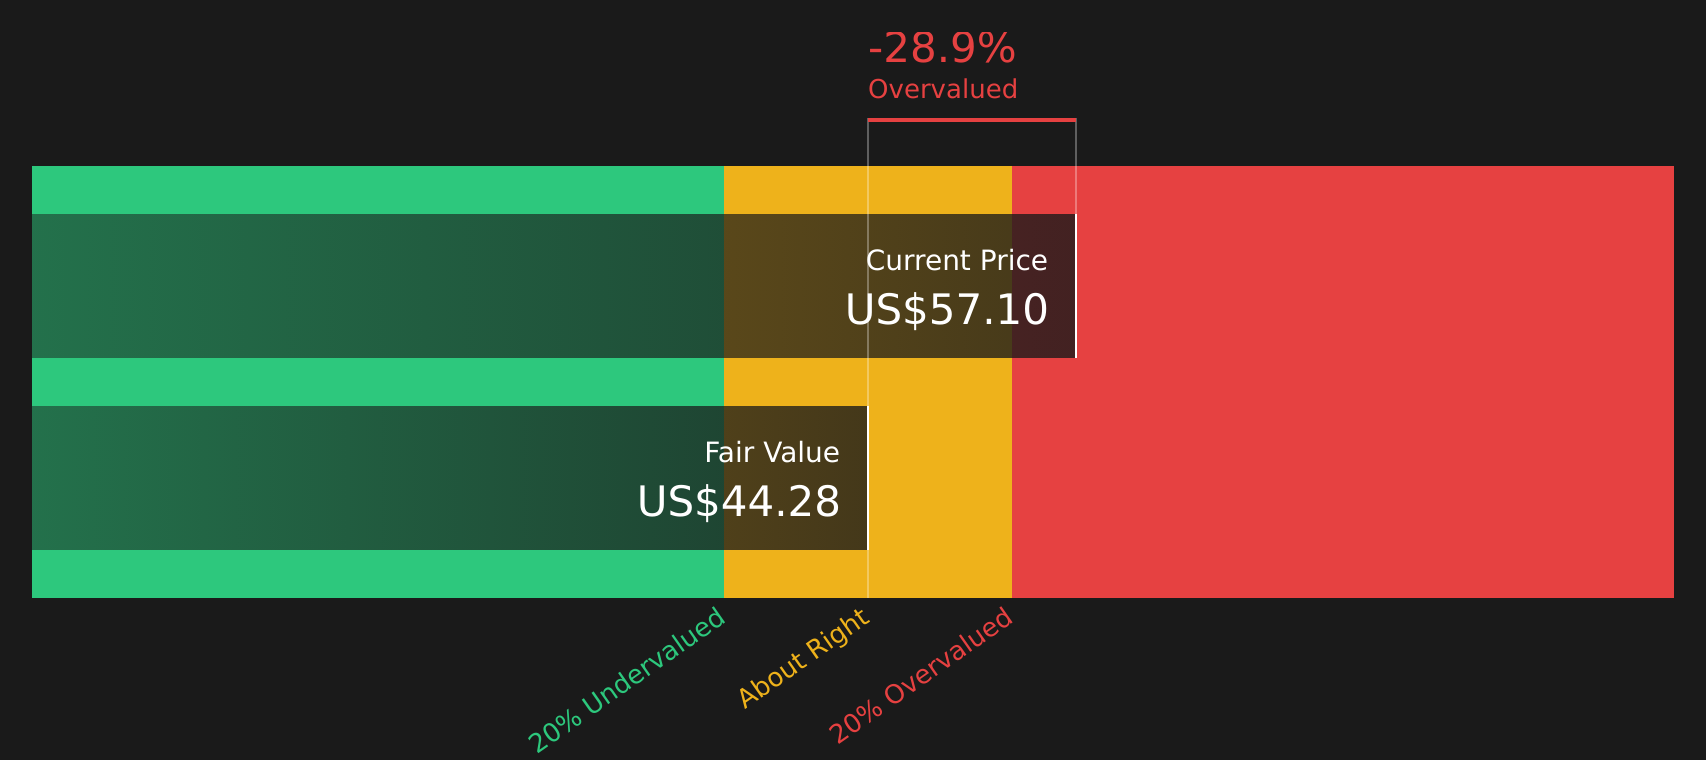
Simply Wall St performs a discounted cash flow (DCF) on every stock in the world every day (check out CBL & Associates Properties for example). We show the entire calculation in full. You can track the result in your watchlist or portfolio and be alerted when this changes, or use our stock screener to discover 51 high quality undervalued stocks. If you save a screener we even alert you when new companies match - so you never miss a potential opportunity.
Next Steps
With mixed signals on valuation and sentiment around CBL & Associates Properties, it makes sense to move quickly and weigh the trade off between its potential and its vulnerabilities based on your own risk tolerance using the 2 key rewards and 4 important warning signs
Looking for more investment ideas beyond CBL & Associates Properties?
If CBL & Associates Properties has sharpened your focus, do not stop here. Broaden your watchlist with other ideas that match your style and risk limits.
- Target potential mispricing opportunities by checking stocks the market may have overlooked through the 51 high quality undervalued stocks
- Strengthen your income game by focusing on companies that aim to keep paying investors through the 9 dividend fortresses
- Prioritise capital protection by concentrating on companies that score well on stability and resilience via the 83 resilient stocks with low risk scores
This article by Simply Wall St is general in nature. We provide commentary based on historical data and analyst forecasts only using an unbiased methodology and our articles are not intended to be financial advice. It does not constitute a recommendation to buy or sell any stock, and does not take account of your objectives, or your financial situation. We aim to bring you long-term focused analysis driven by fundamental data. Note that our analysis may not factor in the latest price-sensitive company announcements or qualitative material. Simply Wall St has no position in any stocks mentioned.