

Is Celanese’s Q2 Margin Squeeze Amid Rising Sales Altering The Investment Case For Celanese (CE)?
Celanese Corporation CE | 0.00 |
- Celanese Corporation reported past second-quarter 2026 results, with sales rising to US$2,752 million from US$2,532 million a year earlier, while net income fell to US$125 million from US$197 million and diluted earnings per share from continuing operations declined to US$1.15 from US$1.89.
- The combination of higher revenue but weaker profitability highlights pressure on margins despite top-line growth, raising questions about cost efficiency and earnings quality within Celanese’s business.
- Next, we’ll examine how this mix of rising sales and reduced earnings reshapes Celanese’s investment narrative and its longer-term profit outlook.
Explore 24 top quantum computing companies leading the revolution in next-gen technology and shaping the future with breakthroughs in quantum algorithms, superconducting qubits, and cutting-edge research.
Celanese Investment Narrative Recap
To own Celanese, you need to believe that its acetyl and engineered materials businesses can convert sales into durable profits despite industry overcapacity, weak visibility and high debt. The latest quarter’s higher revenue but sharply lower earnings underlines that near term, the key catalyst is restoring margins, while the biggest risk remains that cost actions and footprint changes fail to offset pricing and input cost pressures. For now, this earnings miss looks more like a reminder than a reset of that risk.
Against this backdrop, Celanese’s June decision to close its Engineered Materials compounding facility in Ulsan and shift volumes to China and India is particularly relevant. That move ties directly to the margin story, as it is part of the company’s broader effort to optimize its manufacturing footprint and lower structural costs. Whether these network changes can meaningfully improve earnings in light of the latest quarterly compression is what shareholders will be watching next.
But while higher sales might look encouraging, investors should be aware of the unresolved margin pressure and what it could mean for...
Celanese's narrative projects $10.4 billion revenue and $799.7 million earnings by 2029.
Uncover how Celanese's forecasts yield a $68.70 fair value, a 50% upside to its current price.
Exploring Other Perspectives
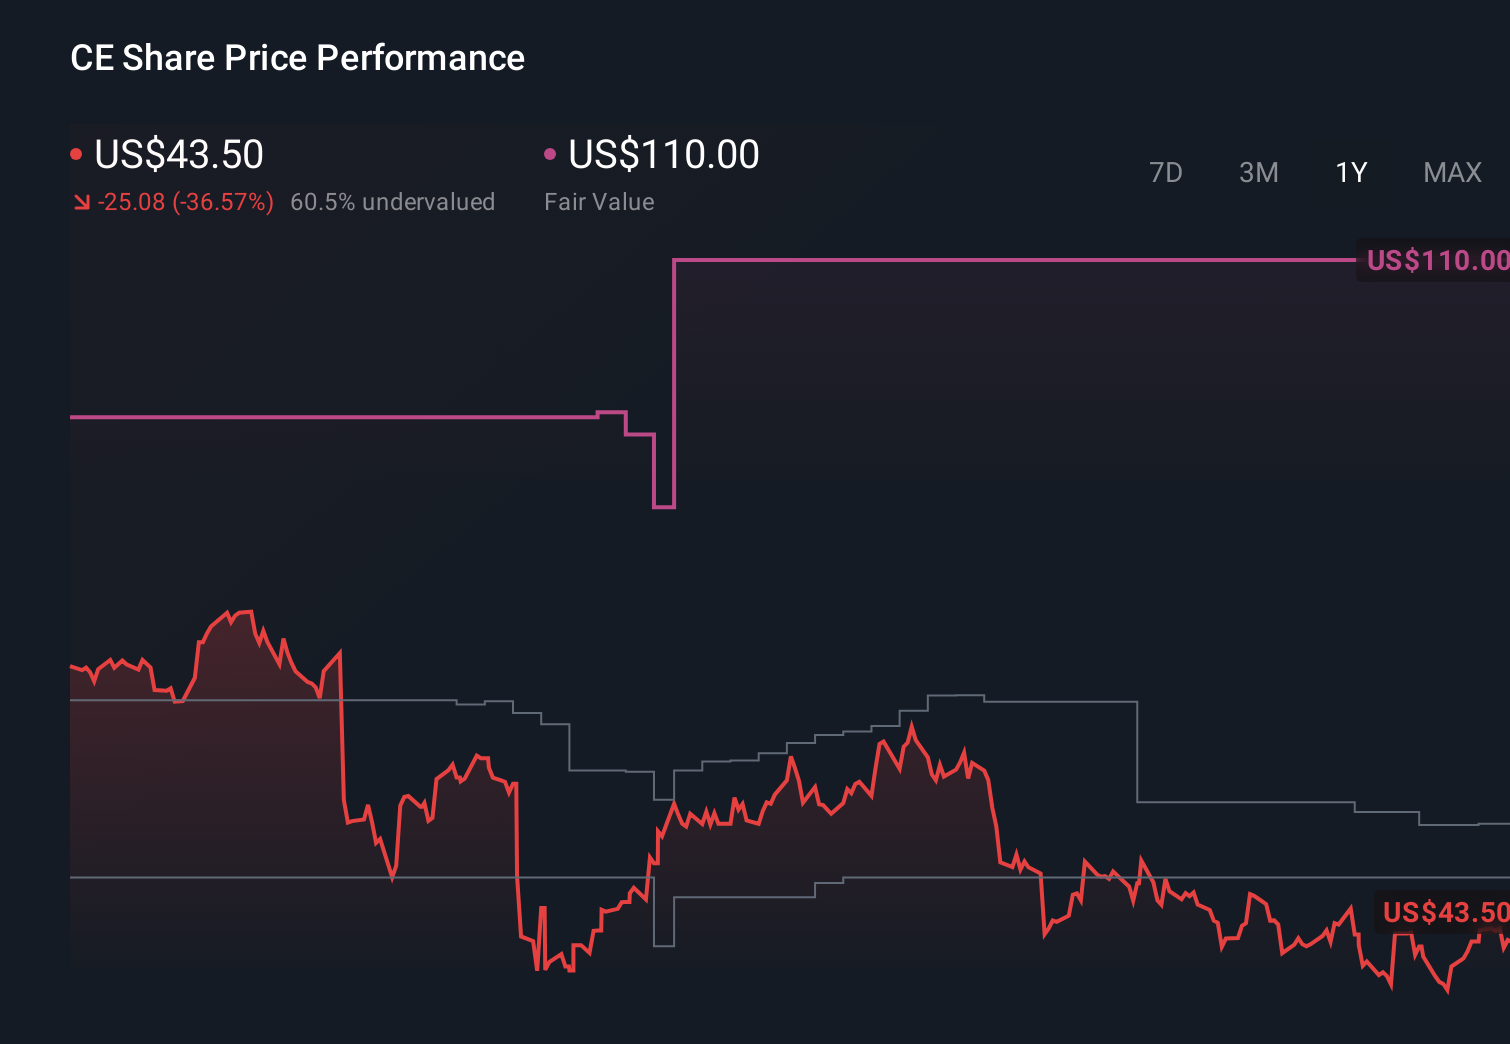
Before this earnings miss, the most optimistic analysts were penciling in about US$11.1 billion of revenue and US$1.0 billion of earnings by 2029, which sits in clear tension with the ongoing pressure from overcapacity and input costs you see in the latest results and shows how widely views can differ, inviting you to weigh these contrasting paths for yourself.
Explore 5 other fair value estimates on Celanese - why the stock might be worth over 2x more than the current price!
Decide For Yourself
Don't just follow the ticker - dig into the data and build a conviction that's truly your own.
- A great starting point for your Celanese research is our analysis highlighting 3 key rewards and 1 important warning sign that could impact your investment decision.
- Our free Celanese research report provides a comprehensive fundamental analysis summarized in a single visual - the Snowflake - making it easy to evaluate Celanese's overall financial health at a glance.
Curious About Other Options?
Our daily scans reveal stocks with breakout potential. Don't miss this chance:
- AI is about to change healthcare. These 42 stocks are working on everything from early diagnostics to drug discovery. The best part - they are all under $10b in market cap - there's still time to get in early.
- The future of work is here. Discover the 37 top robotics and automation stocks leading the charge in AI-driven automation and industrial transformation.
- Capitalize on the AI infrastructure supercycle with our selection of the 55 best 'picks and shovels' of the AI gold rush converting record-breaking demand into massive cash flow.
This article by Simply Wall St is general in nature. We provide commentary based on historical data and analyst forecasts only using an unbiased methodology and our articles are not intended to be financial advice. It does not constitute a recommendation to buy or sell any stock, and does not take account of your objectives, or your financial situation. We aim to bring you long-term focused analysis driven by fundamental data. Note that our analysis may not factor in the latest price-sensitive company announcements or qualitative material. Simply Wall St has no position in any stocks mentioned.