Is Chevron (CVX) Pricing Reflecting Recent Share Gains Or Future Expectations?
Chevron Corporation CVX | 198.97 | +0.79% |
- If you are wondering whether Chevron’s current share price offers real value or implies paying up for future expectations, this article walks through what the numbers actually show.
- Chevron’s share price last closed at US$183.74, with returns of 0.8% over 7 days, 10.5% over 30 days, 17.9% year to date, 21.8% over 1 year and 28.3% over 3 years. These figures provide useful context before comparing that price to underlying value.
- Recent attention on Chevron has been driven by ongoing interest in large integrated energy companies and how they allocate capital across projects and shareholder returns. This backdrop helps frame whether the recent price moves reflect changing risk perceptions or investors reassessing what the business may be worth.
- On our valuation checks, Chevron currently scores 2 out of 6 for being assessed as undervalued, which indicates that some methods see potential value while others are more neutral. Next, we walk through those approaches before finishing with a broader way to think about valuation beyond the usual ratios.
Chevron scores just 2/6 on our valuation checks. See what other red flags we found in the full valuation breakdown.
Approach 1: Chevron Discounted Cash Flow (DCF) Analysis
A Discounted Cash Flow, or DCF, model estimates what a company might be worth today by projecting its future cash flows and discounting them back to a present value.
For Chevron, the model uses a 2 Stage Free Cash Flow to Equity approach. The latest twelve month free cash flow is about US$17.9b, and analysts plus modelled extensions project free cash flow rising to US$30.3b by 2030, with further estimates out to 2035 provided by Simply Wall St. All of these cash flows are forecast in US$, and then discounted to reflect the time value of money and risk.
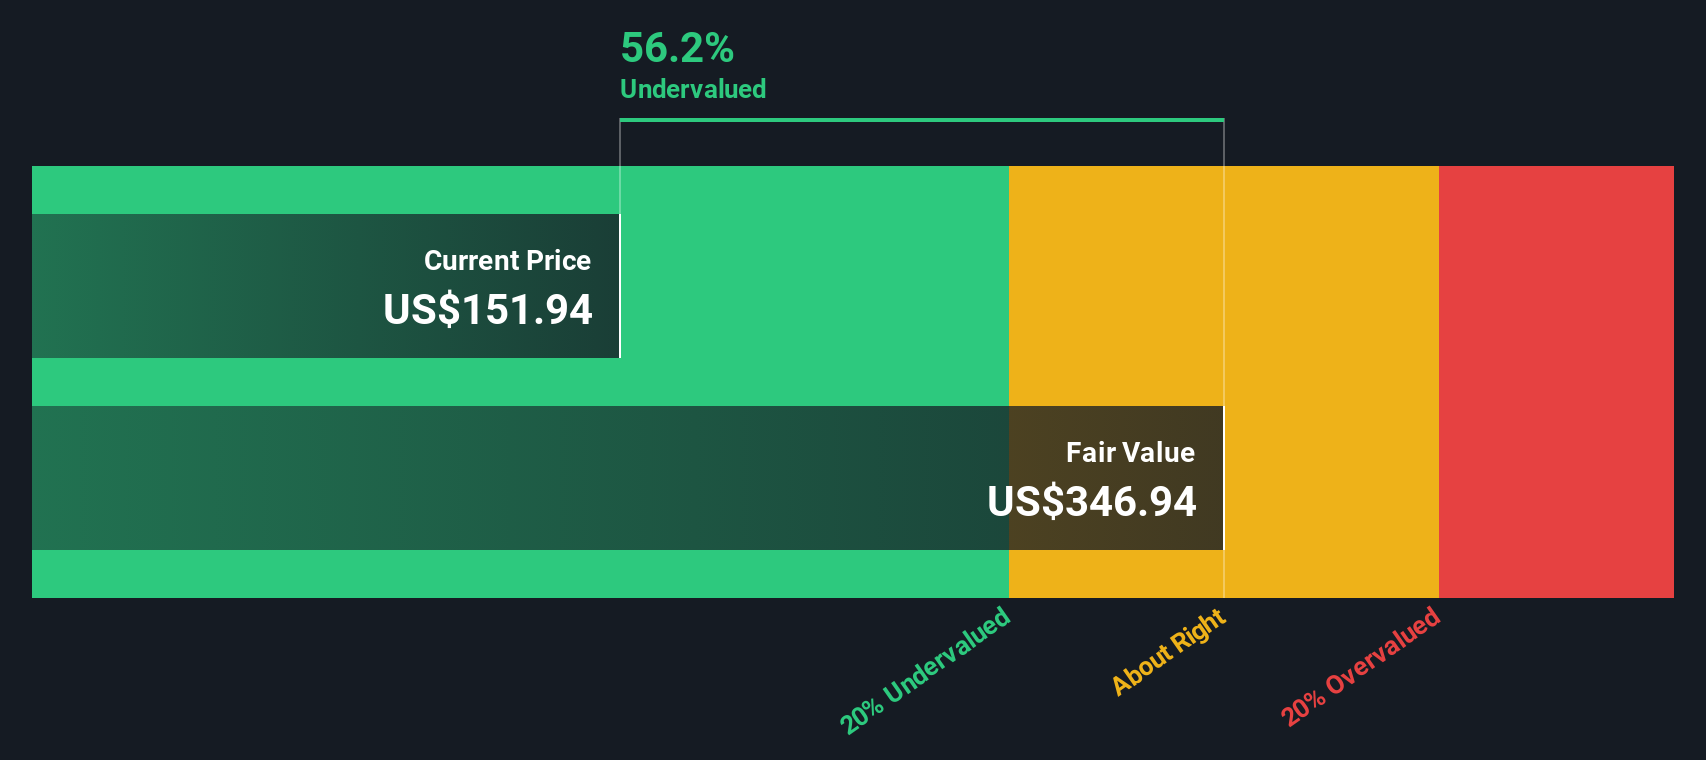
Adding those discounted cash flows together gives an estimated intrinsic value of US$376.51 per share under this DCF framework. Compared with the recent share price of US$183.74, the model output implies Chevron trades at roughly a 51.2% discount to this estimate. This points to the shares being assessed as undervalued on this specific approach.
Result: UNDERVALUED
Our Discounted Cash Flow (DCF) analysis suggests Chevron is undervalued by 51.2%. Track this in your watchlist or portfolio, or discover 55 more high quality undervalued stocks.
Approach 2: Chevron Price vs Earnings
For a profitable company like Chevron, the P/E ratio is a useful way to see how much investors are paying for each dollar of earnings. It ties the share price directly to current profitability, which is usually more stable than revenue alone.
What counts as a “normal” P/E depends on how the market views a company’s growth potential and risk. Higher growth and lower perceived risk can justify a higher multiple, while slower growth or higher risk usually line up with a lower one.
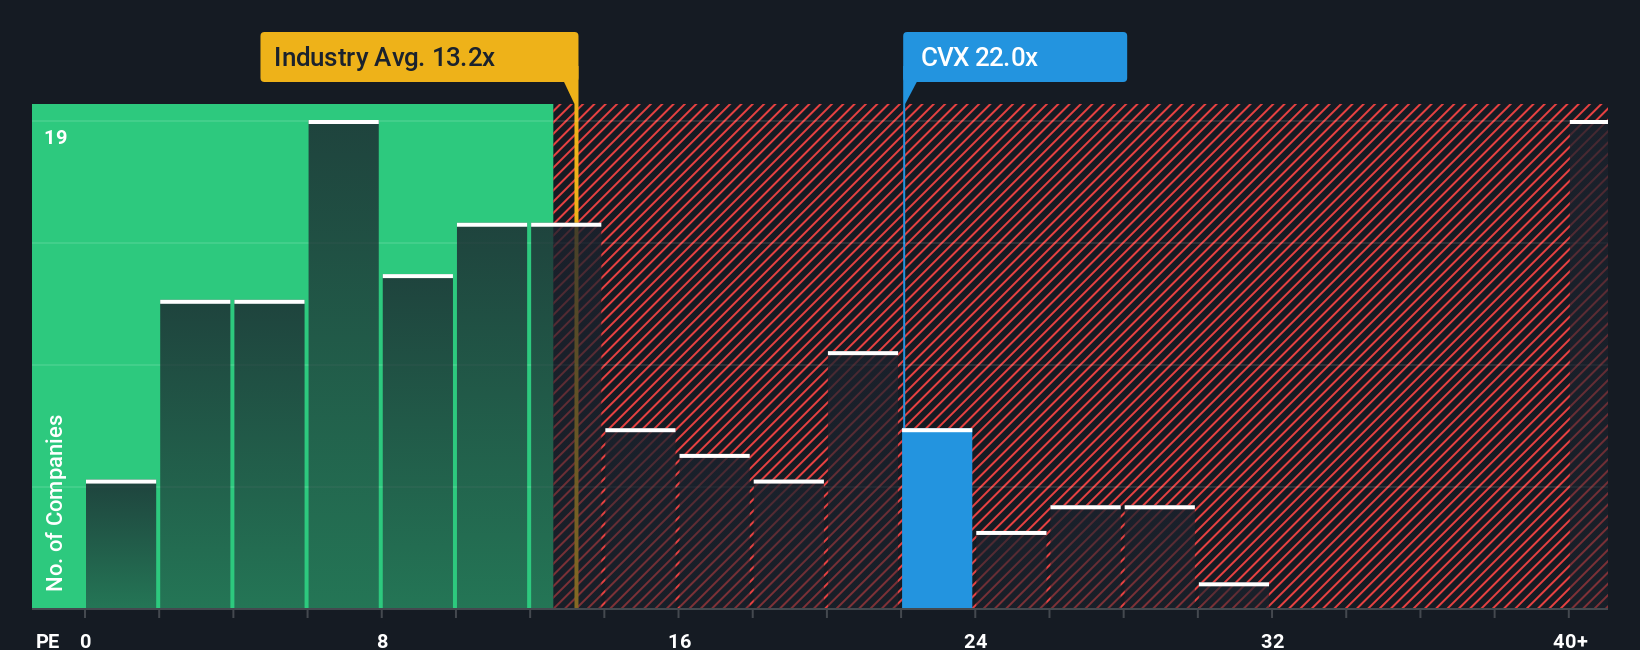
Chevron’s current P/E is about 29.6x. That is above the Oil and Gas industry average of 14.5x and also higher than the peer average of 25.9x, which suggests investors are currently paying a premium relative to many industry names.
Simply Wall St’s Fair Ratio for Chevron is 29.1x. This is a proprietary estimate of what P/E might make sense given factors such as earnings growth, profit margins, industry, market cap and specific risks. Because it blends these company level inputs, it can be more tailored than a simple comparison with industry or peer averages.
With the current P/E of 29.6x sitting slightly above the Fair Ratio of 29.1x, the stock screens as slightly expensive on this metric, but the gap is small enough to treat it as about fair.
Result: ABOUT RIGHT
P/E ratios tell one story, but what if the real opportunity lies elsewhere? Start investing in legacies, not executives. Discover our 23 top founder-led companies.
Upgrade Your Decision Making: Choose your Chevron Narrative
Earlier we mentioned that there is an even better way to understand valuation, so let us introduce you to Narratives, which let you write a clear story about Chevron and then tie that story to specific forecasts for revenue, earnings, margins and a fair value that you can compare directly to today’s price.
On Simply Wall St’s Community page, Narratives are an easy tool used by millions of investors to connect what they believe about Chevron, such as how Venezuela policy, upstream projects or energy transition risks might play out, to numbers like future earnings, profit margins and an assumed P/E, which then roll into a fair value that updates automatically as new news or earnings arrive.
With Chevron, one investor might set up a Narrative that leans on the more bullish assumptions, for example earnings closer to US$26.1b and a P/E near 28.7x, while another could anchor to the more cautious end, nearer US$15.7b in earnings and a lower multiple. By comparing each Narrative’s fair value with the current share price, they can decide for themselves whether that story points to Chevron being above, below or close to what they think it is worth.
Do you think there's more to the story for Chevron? Head over to our Community to see what others are saying!

This article by Simply Wall St is general in nature. We provide commentary based on historical data and analyst forecasts only using an unbiased methodology and our articles are not intended to be financial advice. It does not constitute a recommendation to buy or sell any stock, and does not take account of your objectives, or your financial situation. We aim to bring you long-term focused analysis driven by fundamental data. Note that our analysis may not factor in the latest price-sensitive company announcements or qualitative material. Simply Wall St has no position in any stocks mentioned.