Is Chubb’s (CB) Bigger Payout And Buyback Plan Reframing Its Capital Allocation Story?
Chubb Limited CB | 0.00 |
- Chubb Limited recently secured shareholder approval for a 5.2% increase in its annual dividend to US$4.08 per share and authorized a new US$7.50 billion share repurchase program, while also renewing its capital band and filing a US$4.00 billion shelf registration for common shares tied to an ESOP-related offering.
- Taken together, these moves highlight Chubb’s use of both higher recurring cash returns and flexible capital authorities to reshape its future equity profile.
- We’ll now examine how the dividend increase and sizeable share repurchase authorization influence Chubb’s investment narrative and capital allocation story.
AI is about to change healthcare. These 40 stocks are working on everything from early diagnostics to drug discovery. The best part - they are all under $10b in market cap - there's still time to get in early.
What Is Chubb's Investment Narrative?
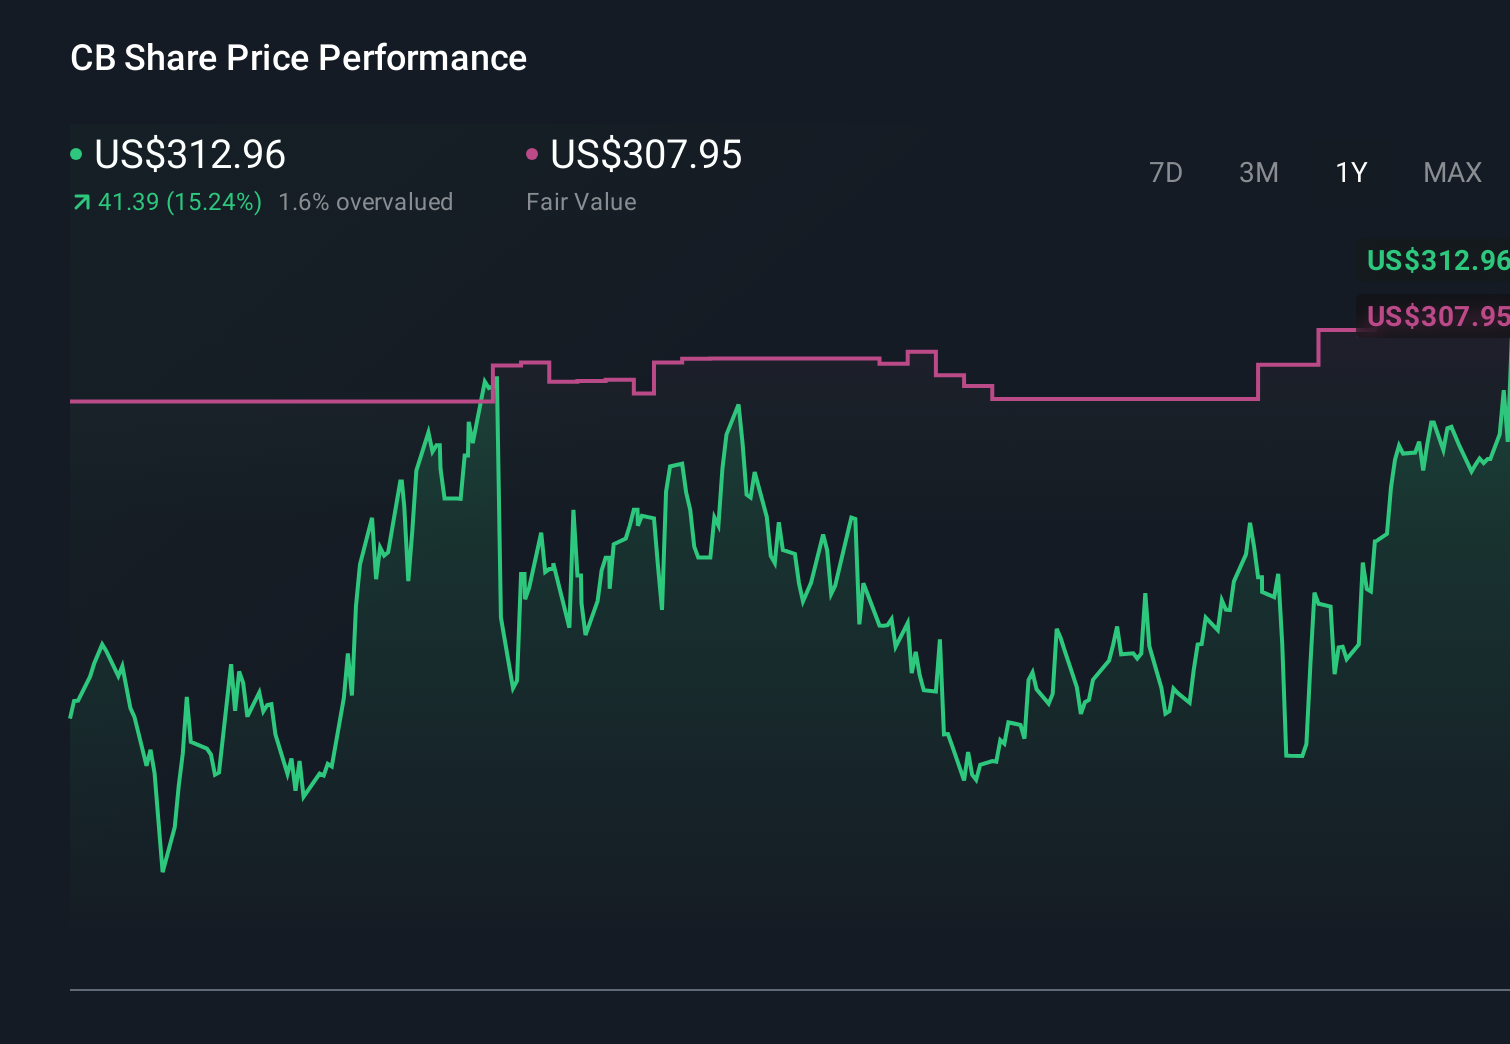
For someone owning Chubb, the core belief is that a large, diversified insurer with disciplined underwriting and conservative balance sheet habits can keep compounding value, even if headline revenue and earnings forecasts point to modest declines over the next few years. The newly approved dividend increase, 33 years in a row, and the US$7.50 billion buyback authorization reinforce that capital return is central to the story, especially after a softer share price patch and a current price still below consensus targets. At the same time, the renewed capital band and US$4.00 billion ESOP shelf show the board wants maximum flexibility to issue or retire shares, which can alter per-share outcomes. Near term, this package is more incremental than transformational, but it sharpens the focus on underwriting quality, catastrophe exposure and any uptick in capital intensity as the real swing factors for the stock.
However, there is one capital decision risk here that investors should not overlook. Despite retreating, Chubb's shares might still be trading above their fair value and there could be some more downside. Discover how much.Exploring Other Perspectives
Three Simply Wall St Community fair value views span roughly US$345 to a very large US$667 per share, underscoring how far apart people can be. Set against that spread, Chubb’s richer dividend and major buyback approval put extra weight on the company’s ability to manage underwriting risks and capital needs without diluting those shareholder returns. Readers may want to weigh these contrasting opinions before deciding where they stand.
Explore 3 other fair value estimates on Chubb - why the stock might be worth just $345.78!
The Verdict Is Yours
Disagree with this assessment? Extraordinary investment returns rarely come from following the herd, so go with your instincts.
- A great starting point for your Chubb research is our analysis highlighting 2 key rewards and 2 important warning signs that could impact your investment decision.
- Our free Chubb research report provides a comprehensive fundamental analysis summarized in a single visual - the Snowflake - making it easy to evaluate Chubb's overall financial health at a glance.
Ready For A Different Approach?
Our top stock finds are flying under the radar-for now. Get in early:
- The future of work is here. Discover the 33 top robotics and automation stocks leading the charge in AI-driven automation and industrial transformation.
- Explore 29 top quantum computing companies leading the revolution in next-gen technology and shaping the future with breakthroughs in quantum algorithms, superconducting qubits, and cutting-edge research.
- Rare earth metals are the new gold rush. Find out which 31 stocks are leading the charge.
This article by Simply Wall St is general in nature. We provide commentary based on historical data and analyst forecasts only using an unbiased methodology and our articles are not intended to be financial advice. It does not constitute a recommendation to buy or sell any stock, and does not take account of your objectives, or your financial situation. We aim to bring you long-term focused analysis driven by fundamental data. Note that our analysis may not factor in the latest price-sensitive company announcements or qualitative material. Simply Wall St has no position in any stocks mentioned.