Is Chubb’s (CB) Middle-Market Pivot Quietly Rewriting Its Long-Term Earnings Playbook?
Chubb Limited CB | 0.00 |
- In recent weeks, Chubb has drawn attention as it prepares to release its second-quarter 2026 results, highlighting growth in middle-market business, expanded distribution agreements, and guidance for adjusted net investment income of about US$1.83 billion to US$1.85 billion.
- Beyond the upcoming earnings release, investors are closely watching how Chubb’s push into middle-market insurance and new distribution partnerships could reshape its long-term growth mix and earnings profile.
- We’ll now examine how Chubb’s renewed focus on middle-market expansion and distribution partnerships may influence its existing investment narrative.
We've uncovered the 7 dividend fortresses yielding 5%+ that don't just survive market storms, but thrive in them.
Chubb Investment Narrative Recap
To own Chubb, you need to believe it can keep compounding value through disciplined underwriting, steady investment income and disciplined capital returns despite sector pricing pressure. The key short term catalyst is the upcoming Q2 2026 earnings release and guidance detail, while the biggest risk remains margin pressure from softening property and large account pricing. Recent analyst commentary pointing to both cautious optimism and concerns about pricing softness does not materially change that near term setup.
The most relevant recent development is Chubb’s guidance for Q2 2026 adjusted net investment income of about US$1.83 billion to US$1.85 billion, which puts more focus on how investment income might offset any underwriting margin pressure. For investors watching the middle market and distribution expansion as longer term drivers, this near term earnings and investment income picture is an important reference point for judging how balanced Chubb’s profit mix may become.
Yet even with these supports, rising competition and price softness in key property lines could quietly erode margins in ways investors should be aware of...
Chubb's narrative projects $50.1 billion revenue and $10.9 billion earnings by 2029. This requires a 6.4% yearly revenue decline and a $0.4 billion earnings decrease from $11.3 billion today.
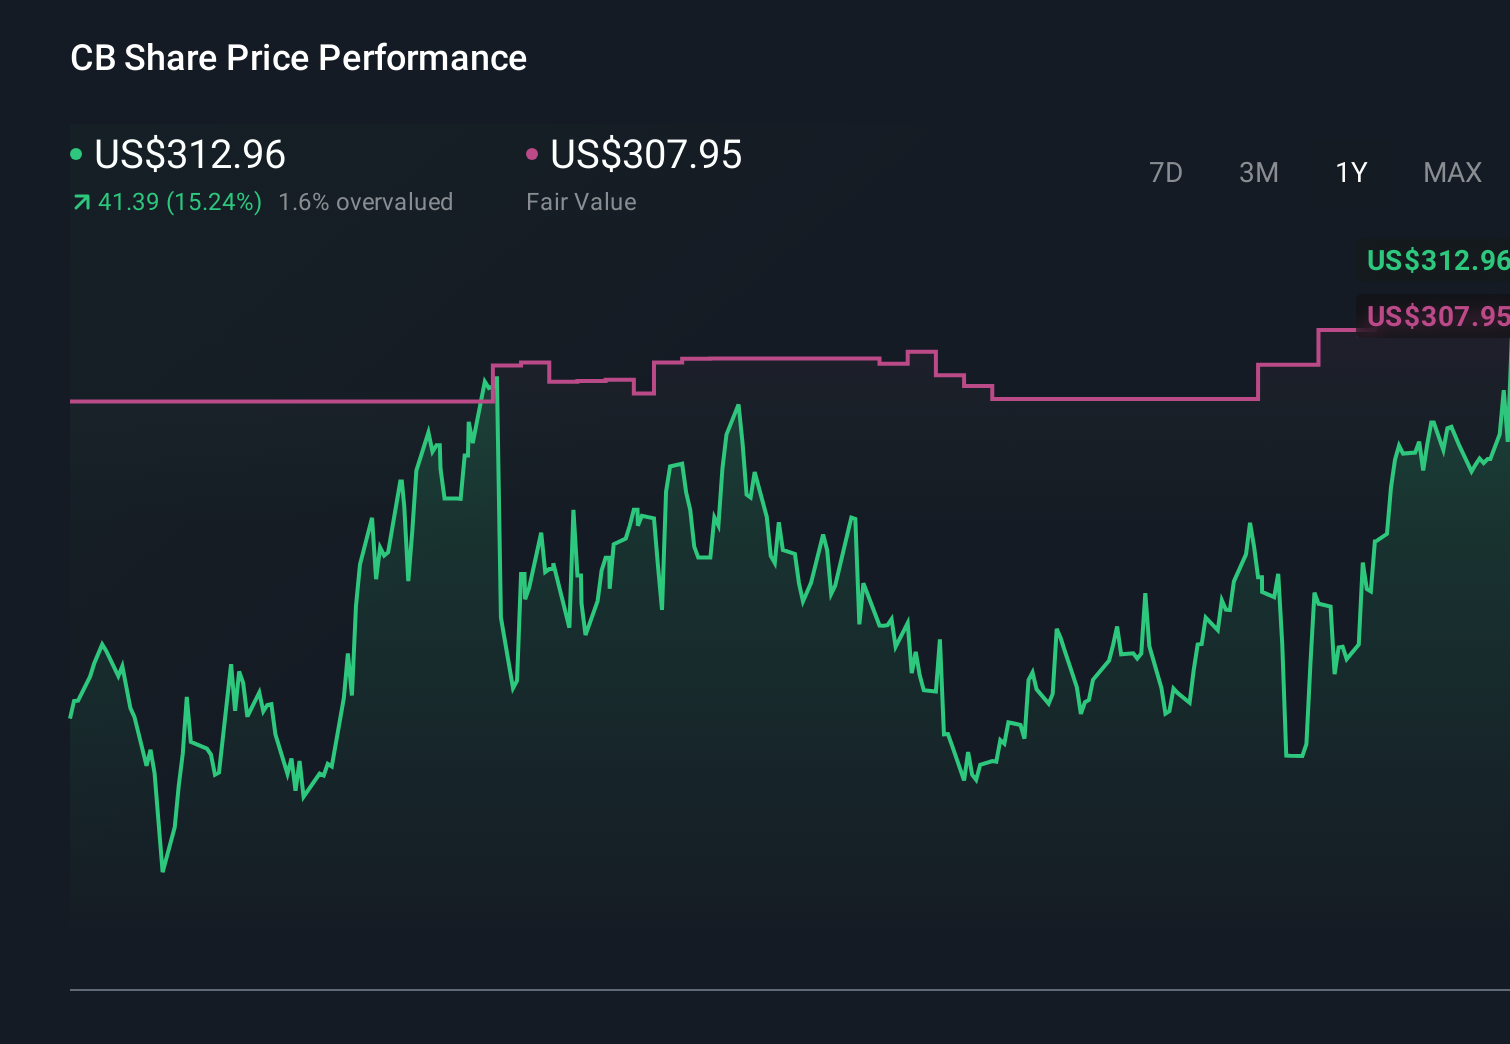
Uncover how Chubb's forecasts yield a $345.04 fair value, a 4% downside to its current price.
Exploring Other Perspectives
Three Simply Wall St Community valuations for Chubb span roughly US$345 to US$662 per share, underscoring how far apart individual views can be. When you weigh those against concerns about pricing softness and margin pressure in property and casualty, it becomes even more important to compare several perspectives before deciding how Chubb might fit into your portfolio.
Explore 3 other fair value estimates on Chubb - why the stock might be worth as much as 83% more than the current price!
Decide For Yourself
Don't just follow the ticker - dig into the data and build a conviction that's truly your own.
- A great starting point for your Chubb research is our analysis highlighting 2 key rewards and 2 important warning signs that could impact your investment decision.
- Our free Chubb research report provides a comprehensive fundamental analysis summarized in a single visual - the Snowflake - making it easy to evaluate Chubb's overall financial health at a glance.
Ready For A Different Approach?
Our daily scans reveal stocks with breakout potential. Don't miss this chance:
- The best AI stocks today may lie beyond giants like Nvidia and Microsoft. Find the next big opportunity with these 16 smaller AI-focused companies with strong growth potential through early-stage innovation in machine learning, automation, and data intelligence that could fund your retirement.
- AI is about to change healthcare. These 40 stocks are working on everything from early diagnostics to drug discovery. The best part - they are all under $10b in market cap - there's still time to get in early.
- Rare earth metals are the new gold rush. Find out which 30 stocks are leading the charge.
This article by Simply Wall St is general in nature. We provide commentary based on historical data and analyst forecasts only using an unbiased methodology and our articles are not intended to be financial advice. It does not constitute a recommendation to buy or sell any stock, and does not take account of your objectives, or your financial situation. We aim to bring you long-term focused analysis driven by fundamental data. Note that our analysis may not factor in the latest price-sensitive company announcements or qualitative material. Simply Wall St has no position in any stocks mentioned.