Is Citigroup (C) Still Attractive After A 76.6% One Year Share Price Surge?
Citigroup Inc. C | 0.00 |
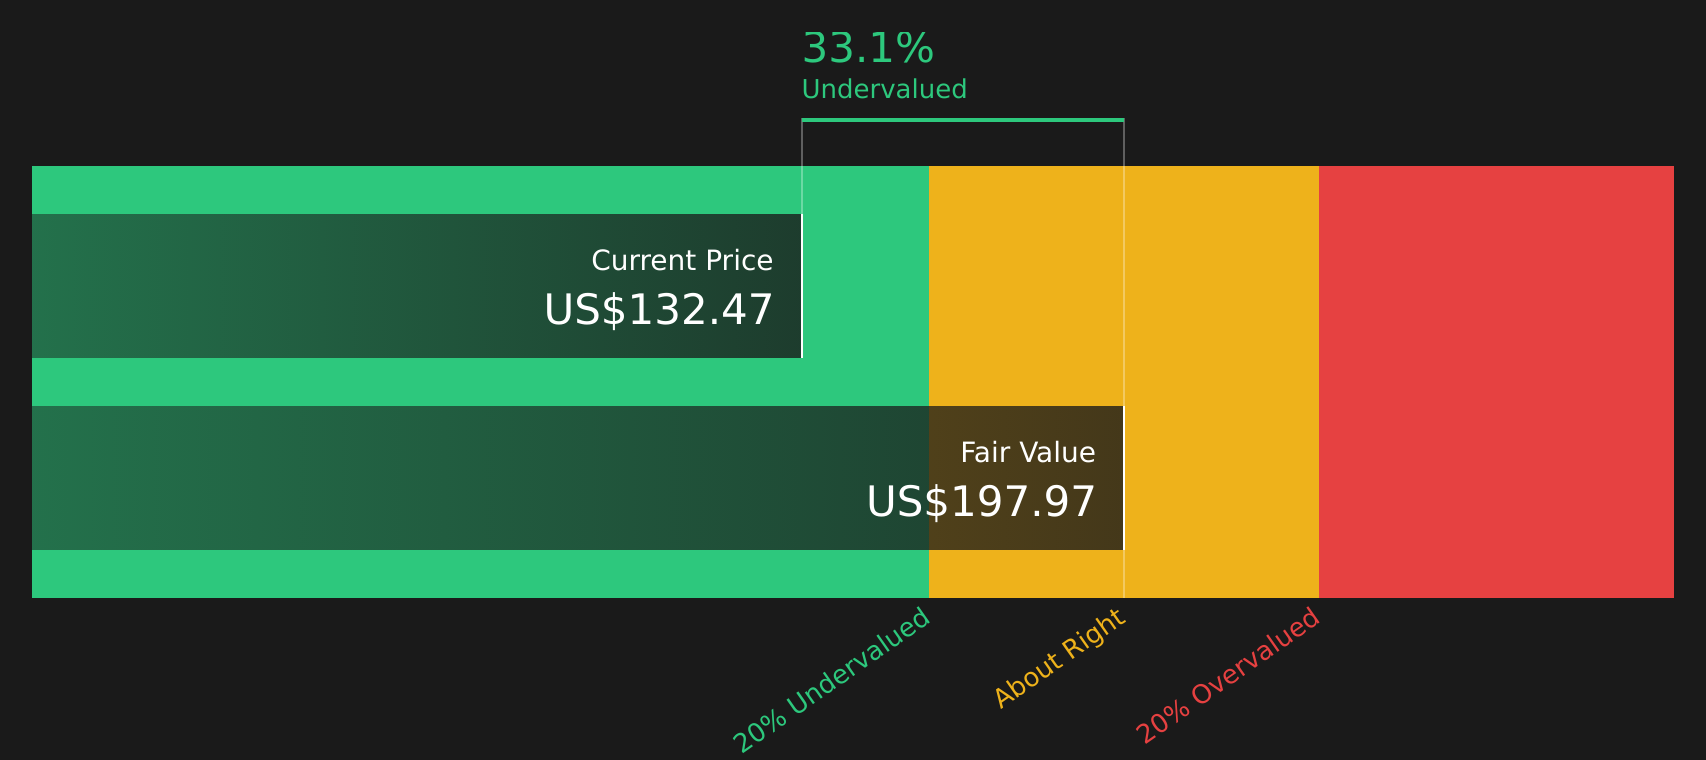
- Wondering if Citigroup at US$134.73 is priced for what it really offers, or if the stock is getting ahead of itself? This article breaks down what the current valuation actually reflects.
- The stock has returned 2.6% over the last 7 days, 7.3% over the last 30 days, 13.5% year to date, 76.6% over 1 year and roughly 3x over 3 years. This puts recent moves into context for anyone thinking about risk and reward.
- Recent coverage of Citigroup has focused on how a large global bank is positioning itself as markets and regulation continue to evolve. This can influence how investors think about its long term earnings power. Commentary has also highlighted how management decisions around capital allocation and efficiency targets feed into sentiment around the stock’s potential.
- Citigroup currently holds a valuation score of 2 out of 6, which means it screens as undervalued on only some of the checks used in this framework. Next, the article will compare different valuation methods that investors commonly use, then finish with a way to think about value that adds an extra layer beyond the standard models.
Citigroup scores just 2/6 on our valuation checks. See what other red flags we found in the full valuation breakdown.
Approach 1: Citigroup Excess Returns Analysis
The Excess Returns model looks at how much value a company can create above the return that equity investors require, then capitalizes those extra earnings into an intrinsic value per share.
For Citigroup, the model starts with a Book Value of US$112.23 per share and a Stable Book Value estimate of US$127.67 per share, based on weighted future book value estimates from 12 analysts. The Average Return on Equity is 10.25%, which feeds into a Stable EPS estimate of US$13.08 per share, sourced from weighted future Return on Equity estimates from 14 analysts.
The required return for shareholders, or Cost of Equity, is US$10.23 per share. On this basis, Citigroup is modeled to generate an Excess Return of US$2.85 per share, which is the earnings above that required return. Capitalizing these excess returns and adding them to the underlying book value produces an Excess Returns intrinsic value estimate of about US$191.50 per share.
Compared with the current share price of US$134.73, this implies the stock trades at a 29.6% discount, so it screens as undervalued on this approach.
Result: UNDERVALUED
Our Excess Returns analysis suggests Citigroup is undervalued by 29.6%. Track this in your watchlist or portfolio, or discover 46 more high quality undervalued stocks.
Approach 2: Citigroup Price vs Earnings
For a profitable company like Citigroup, the P/E ratio is a useful shorthand for how much investors are paying today for each dollar of earnings. It is simple, widely used, and links directly to the earnings that can ultimately support dividends or buybacks.
What counts as a “normal” or “fair” P/E depends on how the market views a company’s earnings growth potential and risk profile. Higher growth or more resilient earnings usually justify a higher multiple, while higher risk or weaker growth tends to pull the multiple down.
Citigroup currently trades on a P/E of 15.64x. This sits above the Banks industry average of 11.68x and the peer average of 12.56x, suggesting the stock carries a higher earnings multiple than many sector peers. Simply Wall St’s Fair Ratio for Citigroup is 15.47x, which is a proprietary estimate of what the P/E might be given factors such as earnings growth characteristics, profit margins, industry, market cap and company specific risks.
The Fair Ratio aims to give a more tailored view than a simple peer or industry comparison because it adjusts for these company specific features rather than treating all banks as identical. With the actual P/E at 15.64x versus a Fair Ratio of 15.47x, the difference is small, so the stock screens as about fairly valued on this metric.
Result: ABOUT RIGHT

P/E ratios tell one story, but what if the real opportunity lies elsewhere? Start investing in legacies, not executives. Discover our 20 top founder-led companies.
Upgrade Your Decision Making: Choose your Citigroup Narrative
Earlier the article mentioned that there is an even better way to understand valuation. This is where Narratives come in, a simple way for you to attach a clear story about Citigroup to the numbers behind your own fair value, revenue, earnings and margin assumptions.
A Narrative on Simply Wall St connects three things: your view of the company’s story, a financial forecast that reflects that view, and the fair value that falls out of those forecasts. This allows you to see in one place what you think Citi is worth and why.
On the Community page, which is used by millions of investors, Narratives are set up so you can quickly compare your fair value to Citigroup’s current share price. This can help you decide whether the stock currently looks expensive or cheap relative to your own expectations rather than a generic model.
Narratives then update automatically as new earnings, news or regulatory developments are fed into Simply Wall St. This means the story and the valuation you are following for Citi stay in sync with fresh information rather than going stale.
For example, one Citigroup Narrative on the platform applies an Excess Returns style view and arrives at a fair value near US$191.50 per share, while another more optimistic community Narrative points to a fair value around US$230. More cautious Narratives sit closer to about US$113, showing how different investors can look at the same company, plug in different growth and margin paths, and reach very different conclusions about what the stock is worth today.
For Citigroup, here are previews of two leading Citigroup Narratives:
Fair value: US$233.04
Implied discount to this fair value at US$134.73: 42.2% undervalued
Revenue growth assumption: 6%
- Views Citi as a major beneficiary of clearer stablecoin regulation, with Citi Token Services as a key driver of institutional digital asset activity.
- Highlights broad strength across Markets, Wealth, Investment Banking, Services and U.S. Personal Banking as support for the valuation.
- Describes buybacks, dividends and targeted returns on tangible equity as important elements of the long term shareholder return story.
Fair value: US$112.86
Implied premium to this fair value at US$134.73: 19.3% overvalued
Revenue growth assumption: 8.32%
- Uses a lower analyst fair value that assumes earnings growth, but with a reduced future P/E multiple compared with today.
- Notes that heavy transformation spending, regulatory requirements and credit risk could weigh on margins and returns if benefits take time to emerge.
- Indicates that for this view to hold, an investor would need to be comfortable with specific assumptions for 2029 revenue, earnings and share count that differ from the more optimistic analyst range.
Together these two Narratives outline a wide range of potential outcomes for Citi and illustrate how different assumptions on growth, profitability and valuation multiples can lead to very different views of what the stock might be worth today. If you want to see the full spread of community views and build your own version of the story, See what the community is saying about Citigroup.
Do you think there's more to the story for Citigroup? Head over to our Community to see what others are saying!

This article by Simply Wall St is general in nature. We provide commentary based on historical data and analyst forecasts only using an unbiased methodology and our articles are not intended to be financial advice. It does not constitute a recommendation to buy or sell any stock, and does not take account of your objectives, or your financial situation. We aim to bring you long-term focused analysis driven by fundamental data. Note that our analysis may not factor in the latest price-sensitive company announcements or qualitative material. Simply Wall St has no position in any stocks mentioned.