Is CNH Industrial (CNH) Now Pricing In Too Much After Recent Share Price Rebound
CNH Industrial NV CNH | 10.65 | -3.36% |
- If you are wondering whether CNH Industrial's current share price really reflects what the business is worth, you are not alone. This article is here to unpack that question in a clear way.
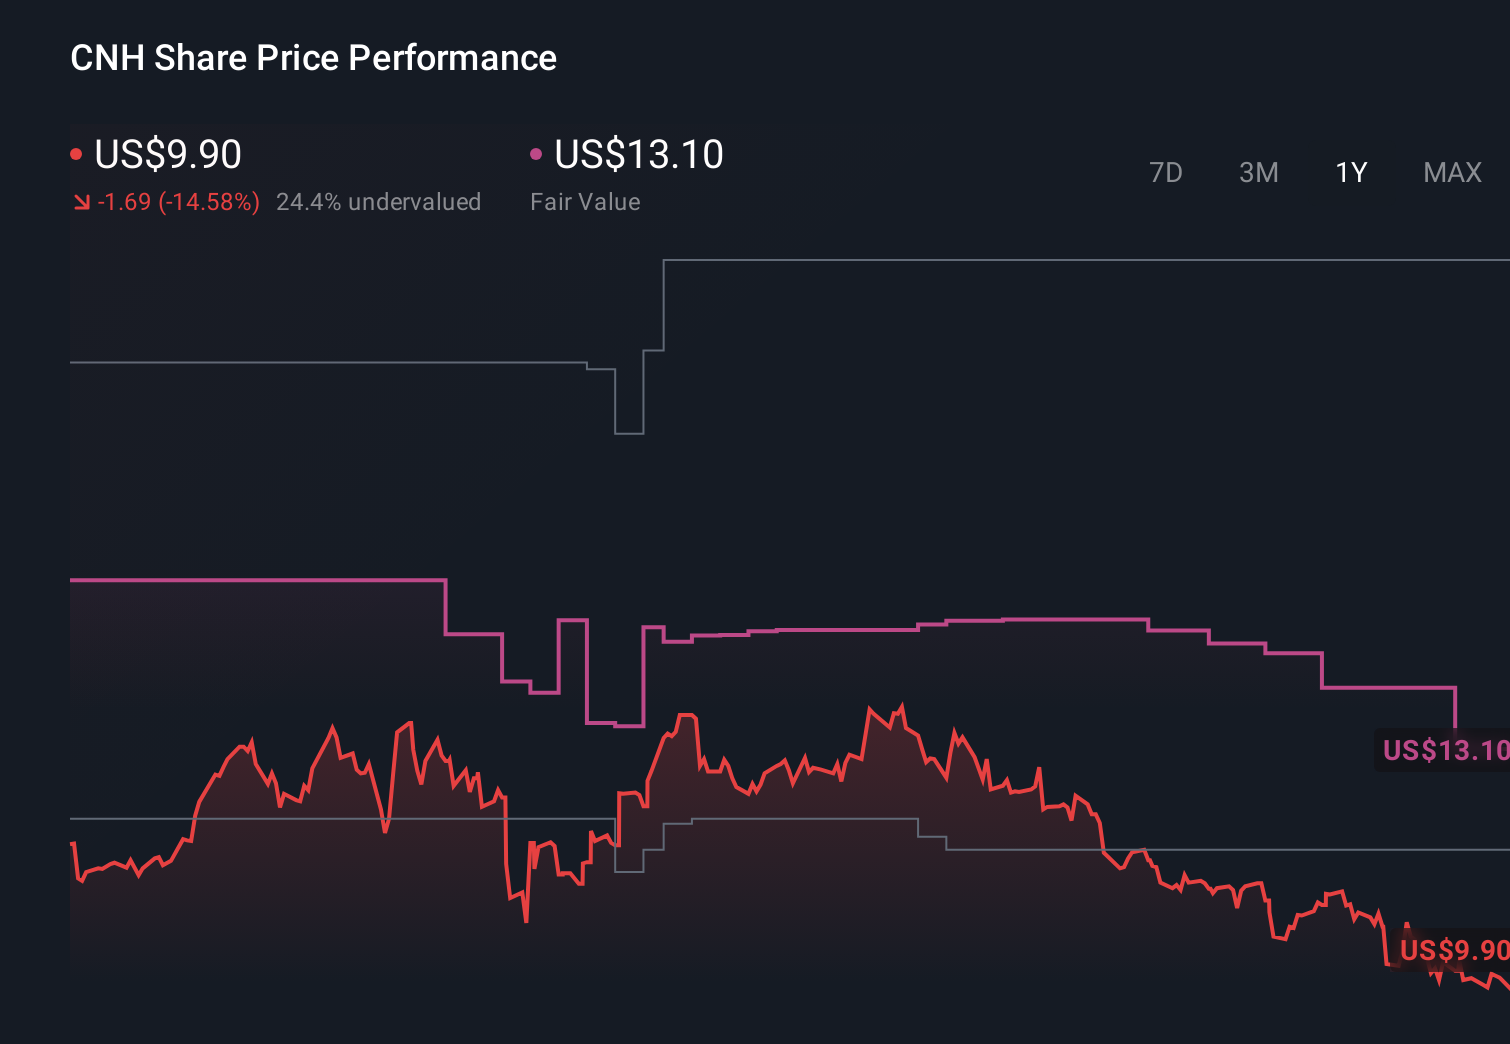
- The stock most recently closed at US$11.05, with returns of 2.1% over 7 days and 18.1% over 30 days, while the 1 year and 3 year returns of negative 12.3% and negative 30.9% show a very different picture to the 18.2% year to date gain.
- These mixed returns have put valuation back in focus for many investors. Longer term holders who experienced the 9.5% return over 5 years may compare that outcome with more recent share price swings. With no single headline event provided to explain the latest moves, it is a good time to step back and let the numbers guide expectations about what you might be paying for today.
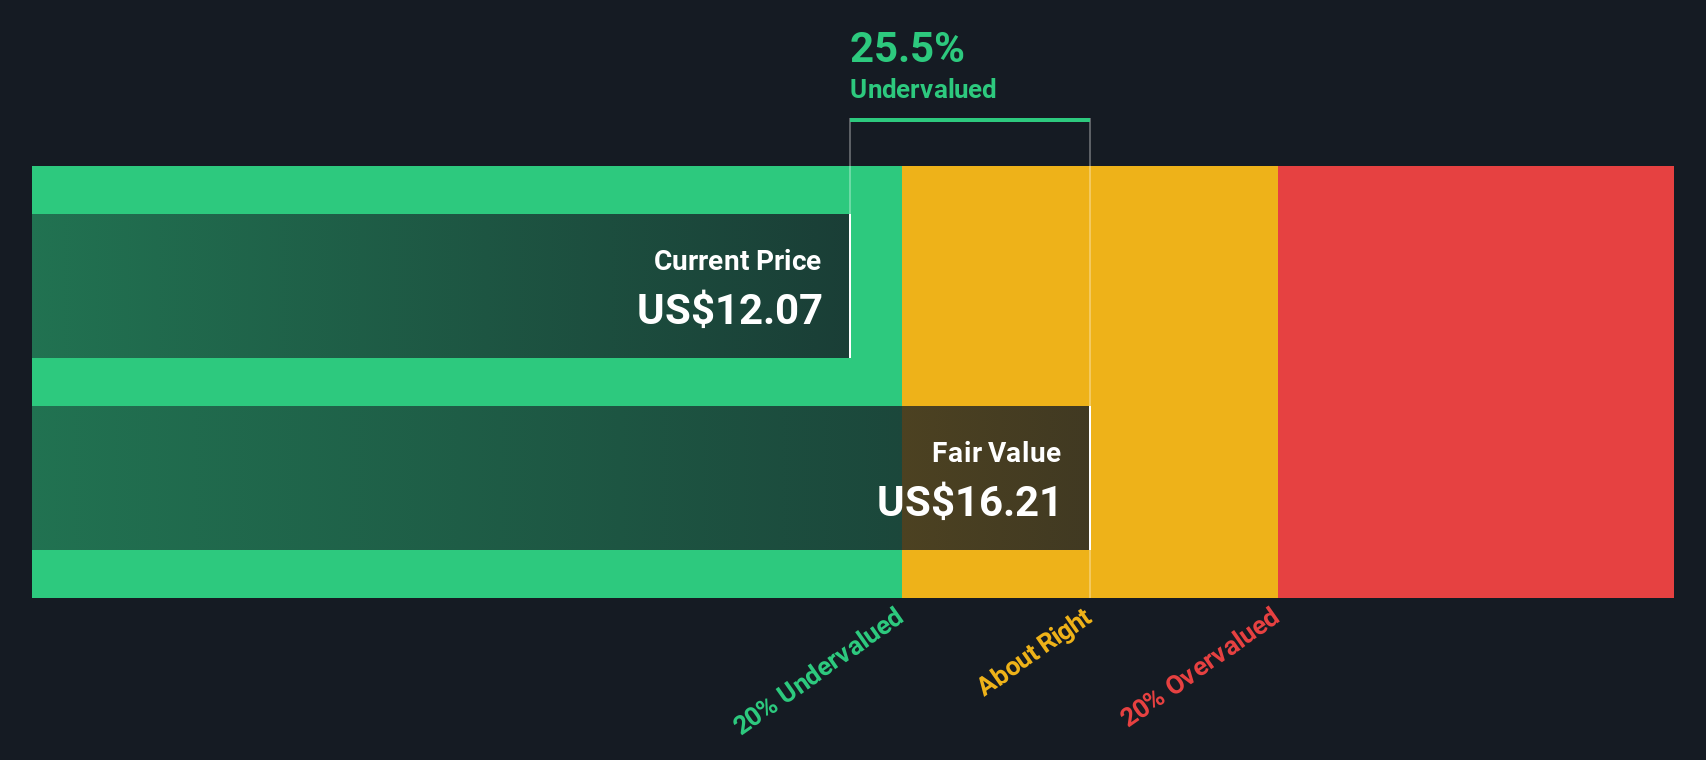
- On our framework, CNH Industrial currently scores 3 out of 6 on the valuation checks, meaning it appears undervalued on half of the measures we look at. You can see the breakdown in this valuation score of 3. Next we will walk through the main valuation approaches before finishing with a different way to think about value that many investors find even more useful.
Approach 1: CNH Industrial Discounted Cash Flow (DCF) Analysis
A Discounted Cash Flow model estimates what a business could be worth by projecting its future cash flows and then discounting those amounts back to today, so you can compare that value to the current share price.
For CNH Industrial, the latest twelve month Free Cash Flow is about US$2.30b. Using a 2 Stage Free Cash Flow to Equity model, analysts and extrapolations are used to project cash flows out to 2035, including a projected Free Cash Flow of US$840m in 2030. Simply Wall St uses analyst estimates where available, then extends the series using its own assumptions for the later years.
On this set of cash flow projections, the model arrives at an estimated intrinsic value of US$6.30 per share. Compared with the recent share price of US$11.05, the DCF output suggests the stock is around 75.5% above this intrinsic value estimate. This points to CNH Industrial trading on the expensive side based on this method alone.
Result: OVERVALUED
Our Discounted Cash Flow (DCF) analysis suggests CNH Industrial may be overvalued by 75.5%. Discover 880 undervalued stocks or create your own screener to find better value opportunities.
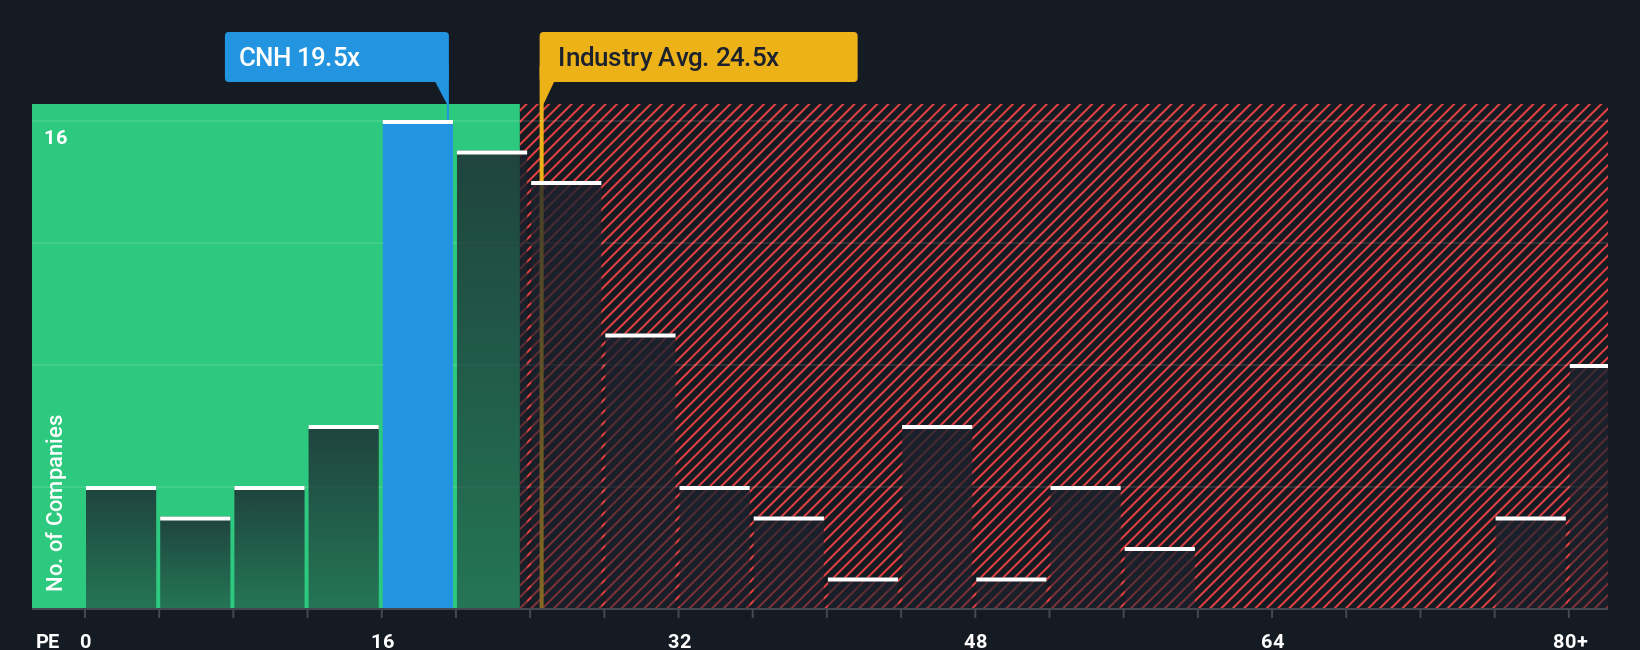
Approach 2: CNH Industrial Price vs Earnings
For a profitable company like CNH Industrial, the P/E ratio is a useful way to relate what you are paying per share to the earnings that the business is currently generating. Investors usually accept a higher P/E when they expect stronger earnings growth or see lower risk, while slower growth or higher risk tends to justify a lower, more conservative multiple.
CNH Industrial is currently trading on a P/E of 23.07x. That sits below the Machinery industry average P/E of 27.39x and also below the peer group average of 24.76x. Simply Wall St also calculates a Fair Ratio of 36.20x for CNH Industrial. This is the P/E level that would be expected given factors such as its earnings growth profile, industry, profit margins, market cap and risk characteristics.
This Fair Ratio is a more tailored guide than a straight comparison with peers or the industry because it aims to adjust for the company’s own growth and risk features rather than assuming all Machinery stocks deserve the same multiple. Comparing the Fair Ratio of 36.20x with the actual P/E of 23.07x suggests CNH Industrial is trading below this model-based reference point.
Result: UNDERVALUED
P/E ratios tell one story, but what if the real opportunity lies elsewhere? Discover 1427 companies where insiders are betting big on explosive growth.
Upgrade Your Decision Making: Choose your CNH Industrial Narrative
Earlier we mentioned that there is an even better way to think about valuation, and that is through Narratives. Narratives let you link your view of CNH Industrial’s story to a financial forecast and then to a fair value estimate you can compare with the current share price.
A Narrative on Simply Wall St is your own story behind the numbers. You set assumptions for future revenue, earnings and margins, and the platform turns that into a forecast and a fair value that sits right alongside today’s market price so you can quickly see whether your view implies the stock is expensive or offers value.
You will find Narratives on the Simply Wall St Community page, where millions of investors share and refine their views. Each Narrative automatically updates when new information such as earnings results or major news is incorporated into the underlying data.
For CNH Industrial, one investor might build a Narrative that assumes relatively cautious revenue growth and margins, producing a lower fair value. Another might assume stronger profitability and a higher long term margin profile, leading to a higher fair value and a very different conclusion about whether the current price looks appealing.
Do you think there's more to the story for CNH Industrial? Head over to our Community to see what others are saying!
This article by Simply Wall St is general in nature. We provide commentary based on historical data and analyst forecasts only using an unbiased methodology and our articles are not intended to be financial advice. It does not constitute a recommendation to buy or sell any stock, and does not take account of your objectives, or your financial situation. We aim to bring you long-term focused analysis driven by fundamental data. Note that our analysis may not factor in the latest price-sensitive company announcements or qualitative material. Simply Wall St has no position in any stocks mentioned.