Is Compass Minerals (CMP) Pricing Fair After Recent Share Price Swings And Valuation Checks
Compass Minerals International, Inc. CMP | 24.70 24.70 | -1.00% 0.00% Pre |
- If you are wondering whether Compass Minerals International at around US$21.75 is priced attractively or not, you are in the right place for a clear look at what the current share price might be implying about value.
- The stock has had a mixed run, with an 80.5% return over the last year, 9.5% year to date and shorter term moves of a 12.9% decline over 7 days and a 4.3% decline over 30 days, which can change how investors view both upside and risk.
- Recent news coverage around Compass Minerals International has focused on longer term business prospects, capital allocation decisions and broader sector sentiment rather than short term trading themes. This kind of context often matters for how the market reacts to new information and can help explain why returns have looked very different over one year compared to the past three and five years.
- Right now, Compass Minerals International scores 2 out of 6 on our valuation checks, which means it screens as undervalued on two of the six methods we use. Next, we will walk through these approaches before finishing with a way to think about what this valuation really means for you.
Compass Minerals International scores just 2/6 on our valuation checks. See what other red flags we found in the full valuation breakdown.
Approach 1: Compass Minerals International Discounted Cash Flow (DCF) Analysis
A Discounted Cash Flow, or DCF, model takes projected future cash flows and discounts them back to today to estimate what the business might be worth right now.
For Compass Minerals International, the model uses a 2 Stage Free Cash Flow to Equity approach, starting from last twelve months free cash flow of about $38.9 million. Analysts provide specific free cash flow estimates up to 2027, including a projection of $46.3 million in 2027. Beyond that, Simply Wall St extends the outlook using its own assumptions, with ten year projections that continue to build on those earlier estimates.
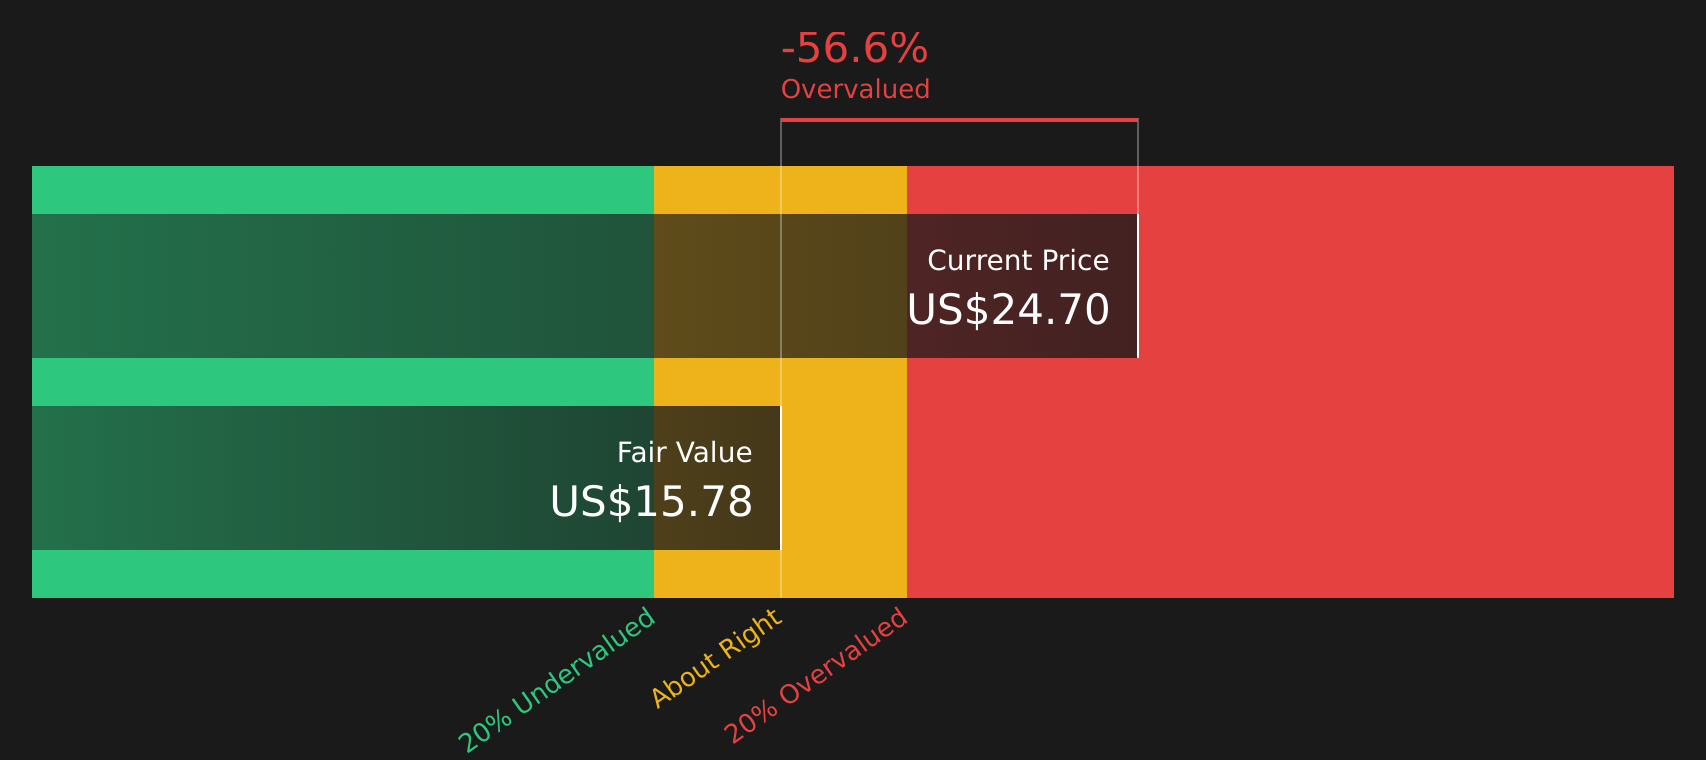
When all those future cash flows are discounted back to today in $, the model arrives at an estimated intrinsic value of $18.06 per share. Compared with the current share price of about $21.75, the DCF indicates the stock is 20.4% overvalued according to this measure.
Result: OVERVALUED
Our Discounted Cash Flow (DCF) analysis suggests Compass Minerals International may be overvalued by 20.4%. Discover 53 high quality undervalued stocks or create your own screener to find better value opportunities.
Approach 2: Compass Minerals International Price vs Sales
For a business like Compass Minerals International, using the P/S ratio can be useful when earnings are weak or volatile, because it compares the share price to the revenue the company generates rather than to its current profit level.
In general, investors tend to accept a higher or lower P/S multiple depending on what they expect for future growth and how risky they believe the business is. Strong, predictable growth and lower perceived risk can support a higher “normal” multiple, while slower growth or higher risk usually means a lower one.
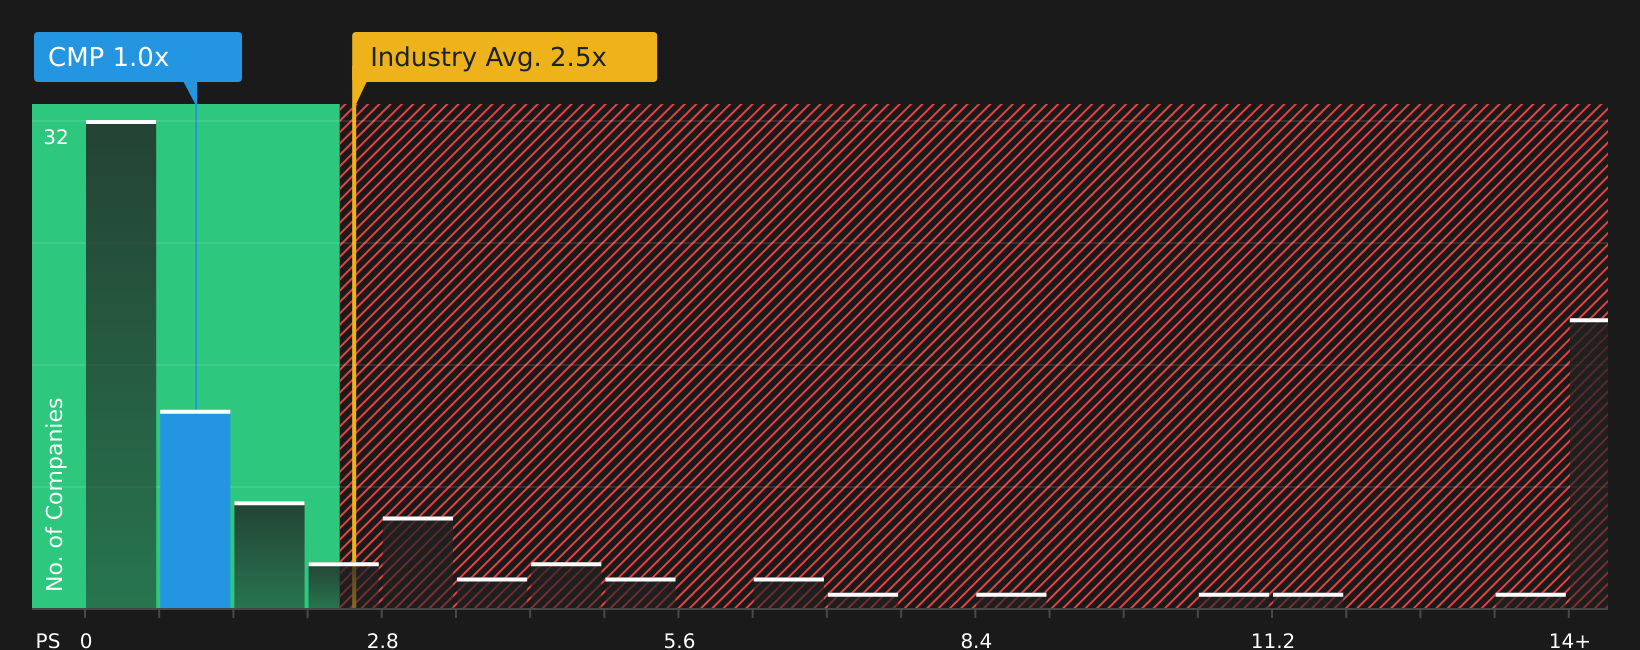
Compass Minerals International currently trades on a P/S of 0.68x. This is below the Metals and Mining industry average P/S of 2.54x and also below the peer group average of 2.19x. Simply Wall St’s Fair Ratio for Compass Minerals International is 0.60x, which is the P/S level its model suggests based on factors such as earnings growth, profit margins, industry, market cap and risk.
The Fair Ratio is more tailored than a simple comparison against peers or the industry, as it attempts to match the multiple to Compass Minerals International’s own growth profile, risk and profitability, not just its sector label.
With the current P/S of 0.68x compared to a Fair Ratio of 0.60x, the shares screen as slightly overvalued on this measure.
Result: OVERVALUED
P/S ratios tell one story, but what if the real opportunity lies elsewhere? Start investing in legacies, not executives. Discover our 22 top founder-led companies.
Upgrade Your Decision Making: Choose your Compass Minerals International Narrative
Earlier we mentioned that there is an even better way to understand valuation, so let us introduce you to Narratives.
A Narrative is simply your story about a company, written in numbers, where you link your view of its products, industry and management to your own expectations for future revenue, earnings, margins and a fair value estimate. On Simply Wall St, Narratives live in the Community page, where millions of investors use them as an easy tool to connect a company’s story to a financial forecast and then to a fair value that they can compare with the current share price. When you compare Fair Value to Price, your Narrative can help you decide whether you see Compass Minerals International as priced attractively, fully priced or expensive for your expectations. Narratives also update automatically when new information such as news or earnings is added, so your view stays current without constant manual tweaking. For Compass Minerals International, one investor might set a Narrative with a relatively high fair value based on optimistic revenue and margin assumptions, while another might choose a much lower fair value based on more cautious estimates.
Do you think there's more to the story for Compass Minerals International? Head over to our Community to see what others are saying!

This article by Simply Wall St is general in nature. We provide commentary based on historical data and analyst forecasts only using an unbiased methodology and our articles are not intended to be financial advice. It does not constitute a recommendation to buy or sell any stock, and does not take account of your objectives, or your financial situation. We aim to bring you long-term focused analysis driven by fundamental data. Note that our analysis may not factor in the latest price-sensitive company announcements or qualitative material. Simply Wall St has no position in any stocks mentioned.