Is Comstock Resources (CRK) Offering Value After Recent Share Price Weakness?
Comstock Resources, Inc. CRK | 19.54 | +1.66% |
- If you are wondering whether Comstock Resources at around US$19.18 is offering good value or carrying more risk than reward, you are in the right place.
- The stock has seen mixed returns, with a 7 day return of 7.8% decline, a 30 day return of 14.2% decline, a year to date return of 18.7% decline, a 1 year return of 5.6%, a 3 year return of 53.4%, and a 5 year return that is a very large multiple of the starting point.
- Recent coverage around Comstock Resources has focused on its role in the US energy sector and how investors are weighing that against broader commodity market conditions. This context helps explain why the share price has moved both up and down over different time frames, as sentiment around future cash flows and risk has shifted.
- On our framework, Comstock Resources currently records a valuation score of 5/6. This sets up an interesting discussion of how different valuation approaches, and an even more comprehensive view at the end of the article, might help you judge whether that score lines up with your own expectations.
Approach 1: Comstock Resources Discounted Cash Flow (DCF) Analysis
A Discounted Cash Flow, or DCF, model looks at the cash Comstock Resources is expected to generate in the future and then discounts those cash flows back to today to estimate what the business might be worth right now.
For Comstock Resources, the latest twelve month free cash flow is a loss of $432.23 million. The model then uses analyst forecasts through 2030 and further extrapolated estimates from Simply Wall St, with projected free cash flow of $367 million in 2030. Across the 2026 to 2035 period, the projections move from around $103.50 million of outflow in 2026 to $544.36 million of inflow in 2035, all in dollars and mostly based on analyst inputs for the earlier years and modeled estimates for the later years.
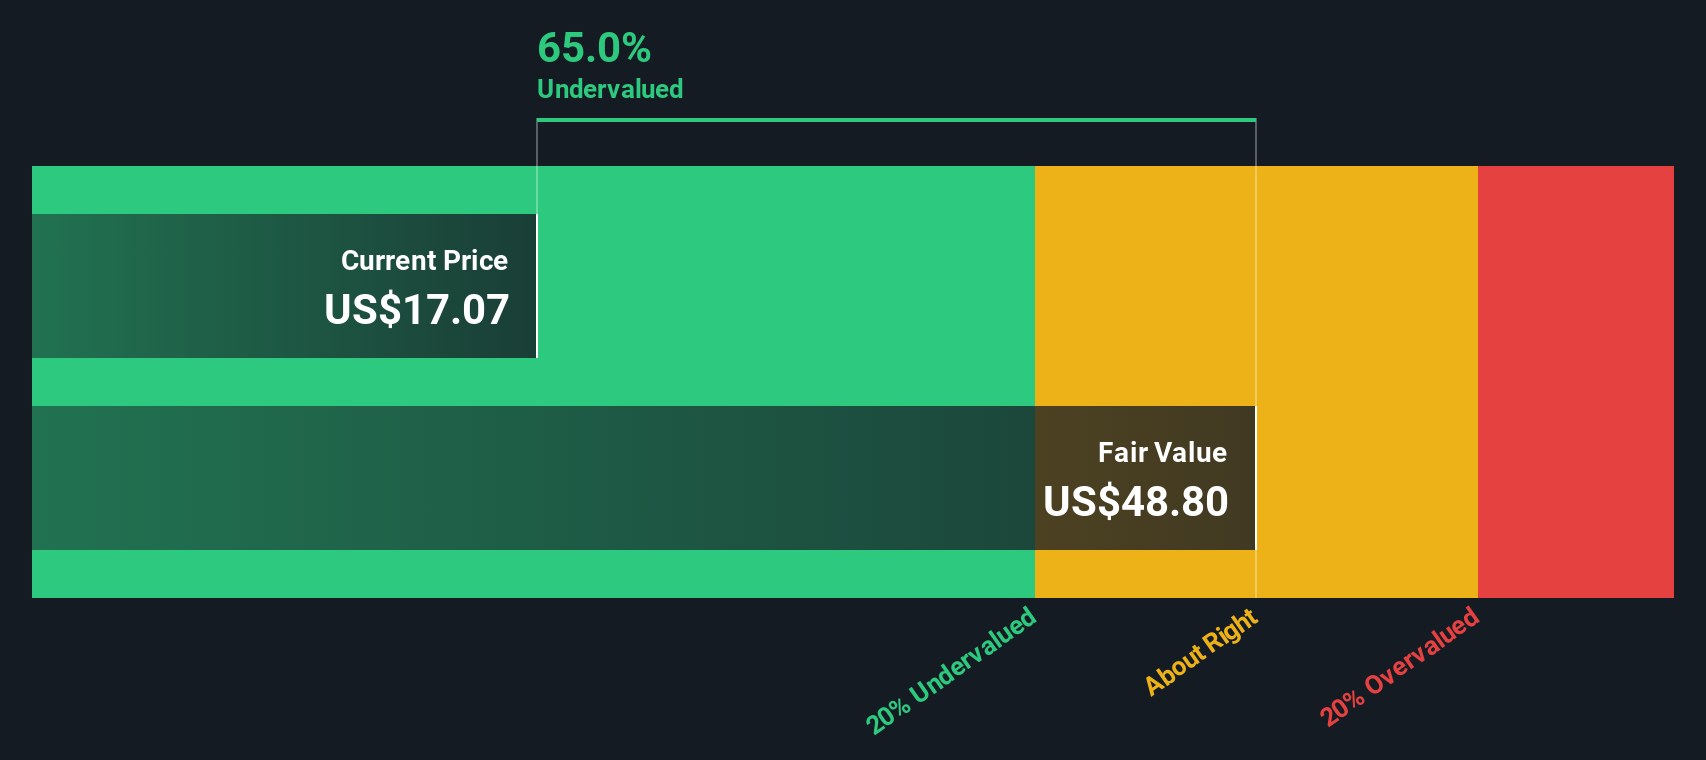
Using these cash flow projections in a 2 Stage Free Cash Flow to Equity model, the DCF estimate comes out at an intrinsic value of about $34.04 per share, compared with a current share price around $19.18. That implies the shares are approximately 43.7% undervalued under this approach.
Result: UNDERVALUED
Our Discounted Cash Flow (DCF) analysis suggests Comstock Resources is undervalued by 43.7%. Track this in your watchlist or portfolio, or discover 55 more high quality undervalued stocks.
Approach 2: Comstock Resources Price vs Earnings
For profitable companies, the P/E ratio is a useful shorthand for how much investors are paying for each dollar of earnings, so it is a natural next step after looking at cash flows. What counts as a normal or fair P/E ratio tends to reflect how the market views a company’s growth outlook and risk profile, with higher growth and lower perceived risk often lining up with higher P/E levels.
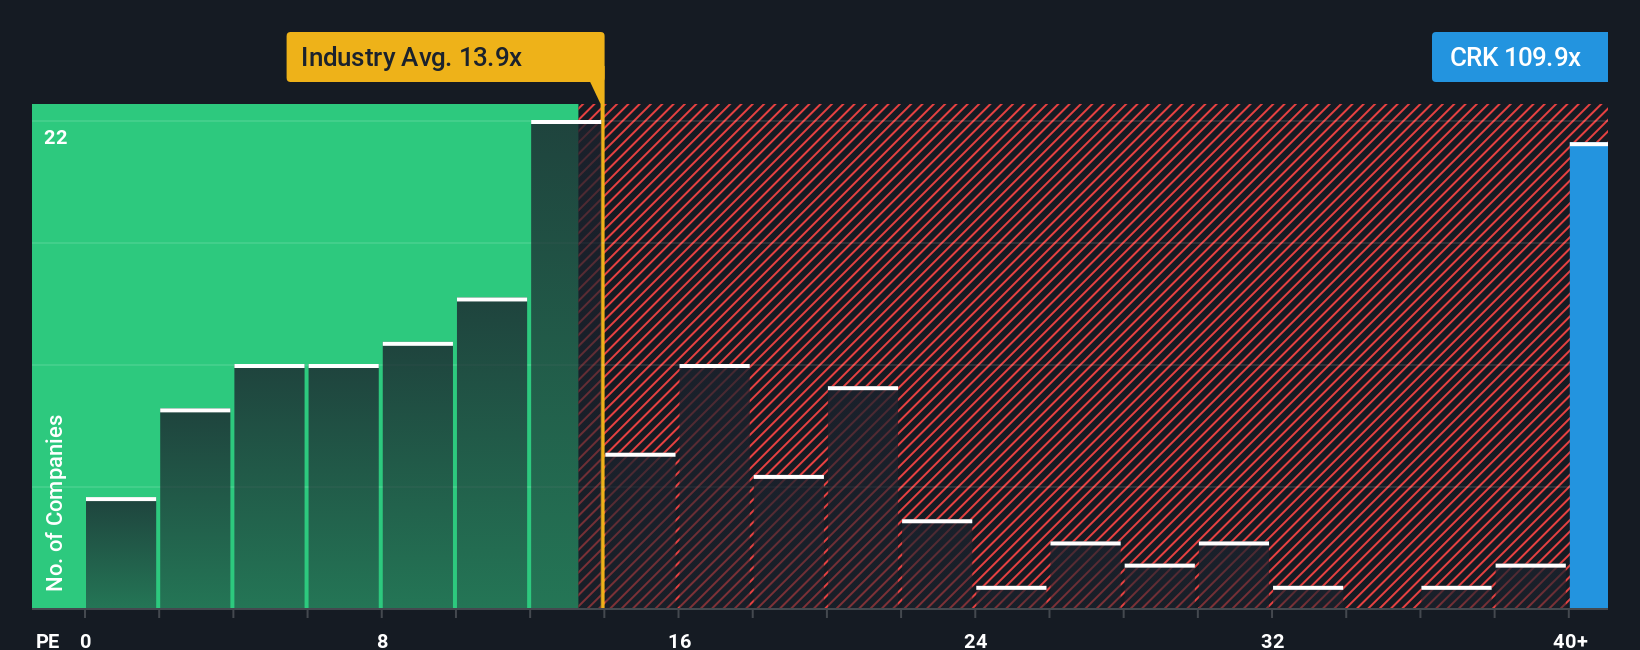
Comstock Resources currently trades on a P/E of 14.21x. That sits close to the Oil and Gas industry average P/E of 14.50x and below the peer group average of 27.43x, which shows that investors are assigning it a lower multiple than many peers in the same space.
Simply Wall St’s Fair Ratio for Comstock Resources is 16.70x. This is a proprietary view of what the P/E might be given factors such as earnings growth, industry, profit margin, market cap and risks. It can be more informative than a simple industry or peer comparison because it attempts to adjust for company specific characteristics rather than assuming all Oil and Gas stocks deserve the same multiple. With the current P/E of 14.21x sitting below the Fair Ratio of 16.70x, this approach points to Comstock Resources looking undervalued on earnings.
Result: UNDERVALUED
P/E ratios tell one story, but what if the real opportunity lies elsewhere? Start investing in legacies, not executives. Discover our 23 top founder-led companies.
Upgrade Your Decision Making: Choose your Comstock Resources Narrative
Earlier we mentioned that there is an even better way to understand valuation. Let us introduce Narratives, where you spell out your story for Comstock Resources by linking your views on future revenue, earnings and margins to a forecast and fair value. You can then compare that fair value to the current price, all within Simply Wall St’s Community page, which is used by millions of investors and updates automatically when new news or earnings are added. For example, one investor might plug in more bearish assumptions that point to a fair value near US$8.76, while another leans on a more optimistic set of assumptions closer to US$31.60. Both can clearly see how their story, numbers and view on whether the stock looks attractive or not all fit together.
For Comstock Resources however we will make it really easy for you with previews of two leading Comstock Resources Narratives:
Fair value in this bullish narrative: US$20.71 per share.
At the last close of US$19.18, the price sits around 7.4% below that fair value estimate.
Revenue growth assumption: 13.6% a year.
- Analysts in this camp focus on Comstock Resources position in the Western Haynesville and the potential for improved drilling efficiency and margins to support higher earnings over time.
- They highlight plans for midstream build out, asset monetization and collaborations such as the NextEra Energy agreement as ways to support liquidity, cash flow and new long term sales channels.
- Key risks in this narrative center on concentration in a single basin, capital intensity, regulation and longer term questions around natural gas demand and financing conditions.
Fair value in this bearish narrative: US$8.76 per share.
At the last close of US$19.18, the price sits around 118.9% above that fair value estimate.
Revenue growth assumption: 7.6% a year.
- This view leans on the idea that global energy transition, regulation and reliance on Haynesville natural gas could cap long term revenues and compress valuation support.
- Higher expected costs, capital constraints and ESG pressure are treated as ongoing headwinds for margins, P/E support and access to financing, even if operations remain efficient.
- Supporters of this narrative still acknowledge the quality of the acreage and infrastructure but see the current market expectations as rich relative to their assumptions for earnings and risk.
Both narratives use the same company and many of the same facts, yet they arrive at very different fair values. Your job as an investor is to decide which set of assumptions, if either, feels closer to how you see Comstock Resources future playing out.
Do you think there's more to the story for Comstock Resources? Head over to our Community to see what others are saying!

This article by Simply Wall St is general in nature. We provide commentary based on historical data and analyst forecasts only using an unbiased methodology and our articles are not intended to be financial advice. It does not constitute a recommendation to buy or sell any stock, and does not take account of your objectives, or your financial situation. We aim to bring you long-term focused analysis driven by fundamental data. Note that our analysis may not factor in the latest price-sensitive company announcements or qualitative material. Simply Wall St has no position in any stocks mentioned.