Is Copart (CPRT) Offering Opportunity After A 33% Share Price Pullback?
Copart, Inc. CPRT | 33.40 | +1.15% |
- If you are wondering whether Copart's current share price really matches its underlying worth, you are not alone. That is exactly what this article will help you unpack.
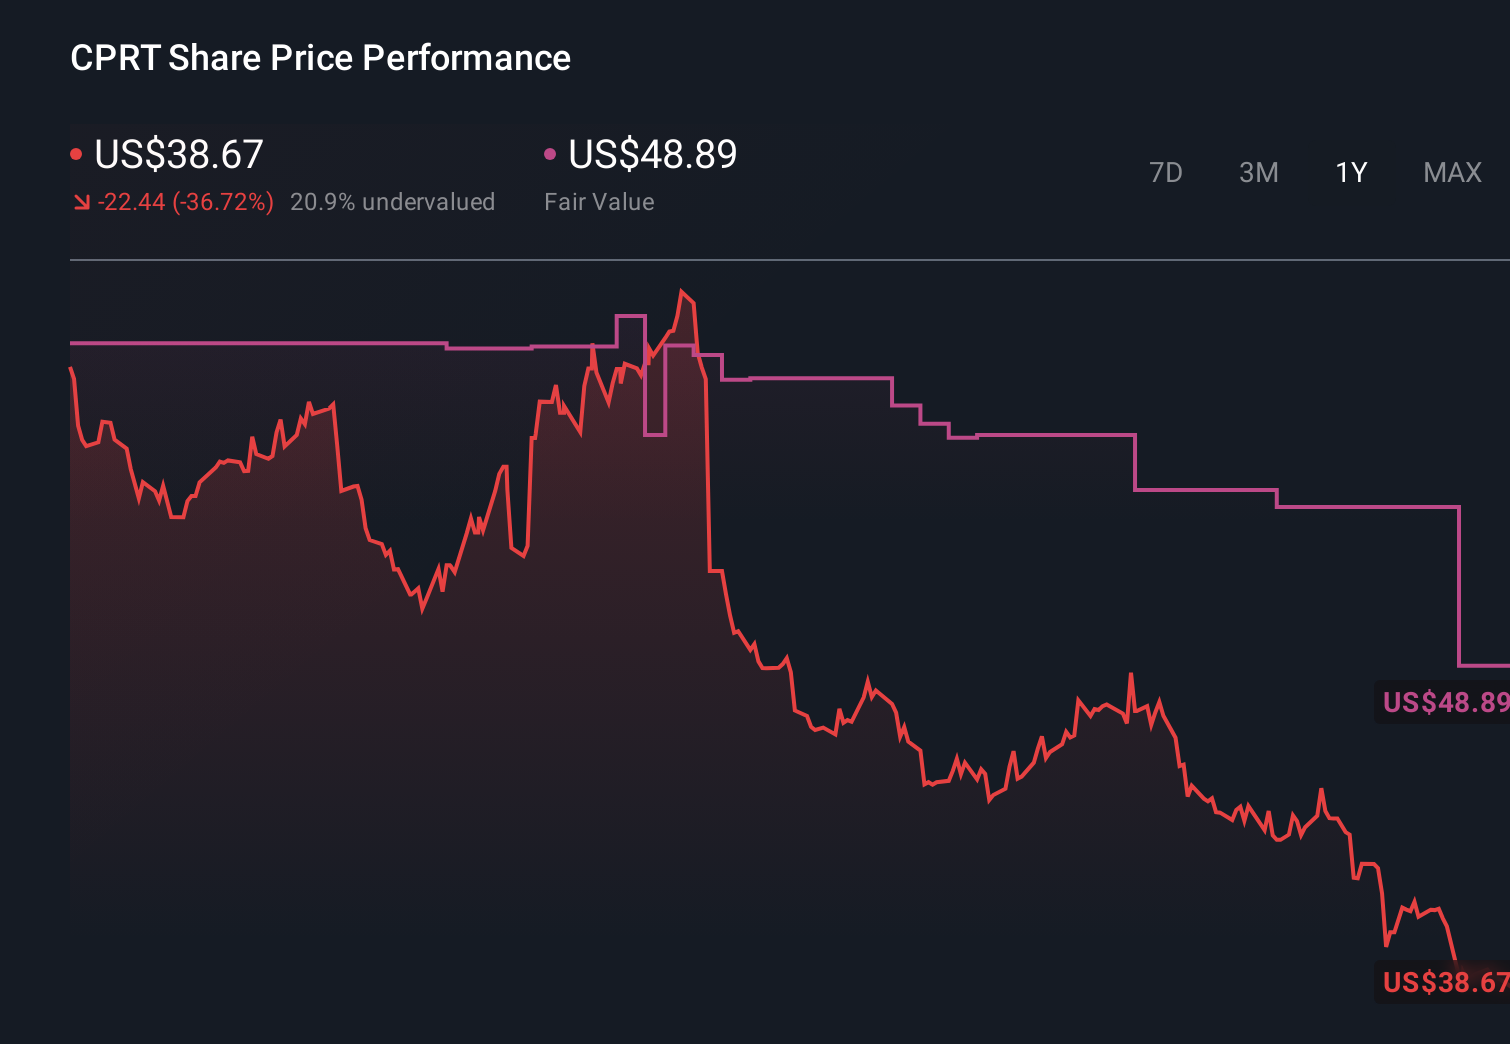
- Over the past year the stock is down 33.1%, even though it is up 4.6% year to date. This can change how investors think about both its growth potential and its risk profile.
- Recent headlines around Copart have focused on its role in vehicle remarketing and salvage auctions, as investors watch how demand for used and damaged vehicles shapes its business. This backdrop helps explain why the share price has been more sensitive to changes in sentiment about volumes, pricing and recovery values.
- Right now Copart scores 4 out of 6 on our valuation checks, and you can see the full breakdown of that valuation score. Next we will look at how methods like discounted cash flow and multiples compare, before finishing with a more holistic way to think about what the stock might be worth.
Approach 1: Copart Discounted Cash Flow (DCF) Analysis
A DCF model takes Copart’s expected future cash flows, discounts them back to today using a required rate of return, and adds them up to estimate what the whole business might be worth right now.
For Copart, the model used is a 2 Stage Free Cash Flow to Equity approach. The latest twelve month free cash flow is about $1,297.6 million, and Simply Wall St combines analyst estimates with its own extrapolations to extend that out over the next decade. Within that path, projected free cash flow in 2028 is $1,686 million, and discounted values are provided for each year through 2035 in the ten year projection set.
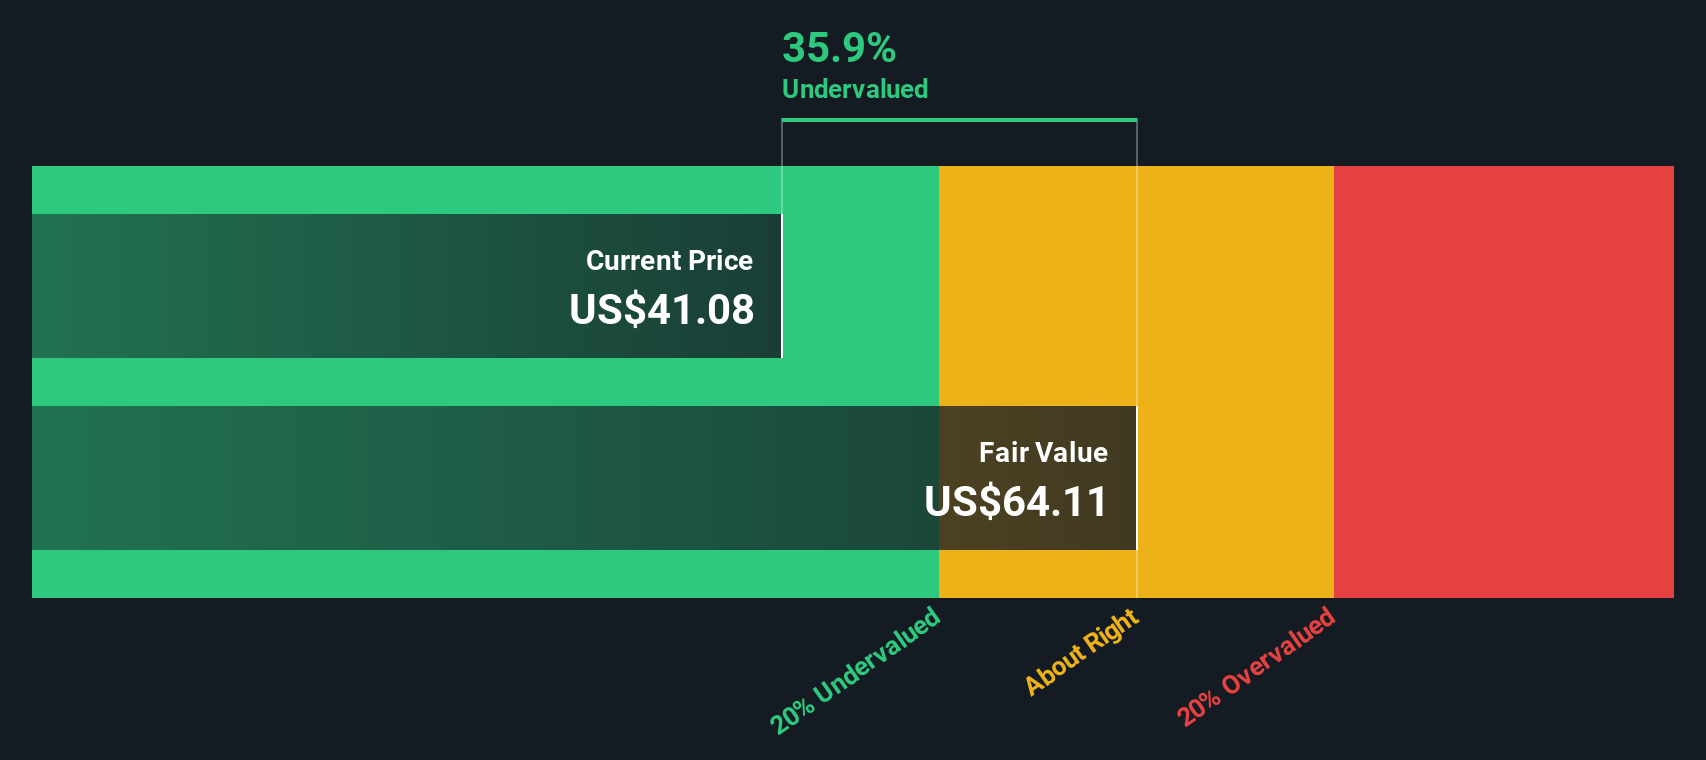
Putting those cash flow projections together, the DCF model arrives at an estimated intrinsic value of $49.10 per share. Compared with the current share price, this indicates that, on this model, Copart trades at a 19.5% discount and therefore appears undervalued rather than fully priced.
Result: UNDERVALUED
Our Discounted Cash Flow (DCF) analysis suggests Copart is undervalued by 19.5%. Track this in your watchlist or portfolio, or discover 51 more high quality undervalued stocks.
Approach 2: Copart Price vs Earnings
For profitable companies like Copart, the P/E ratio is a useful way to see how much you are paying for each dollar of earnings. This makes it a straightforward yardstick to compare against similar businesses.
What counts as a “normal” P/E depends on what the market expects for growth and how risky those earnings are perceived to be. Higher expected growth or lower perceived risk can justify a higher P/E, while slower growth or higher risk usually points to a lower P/E.
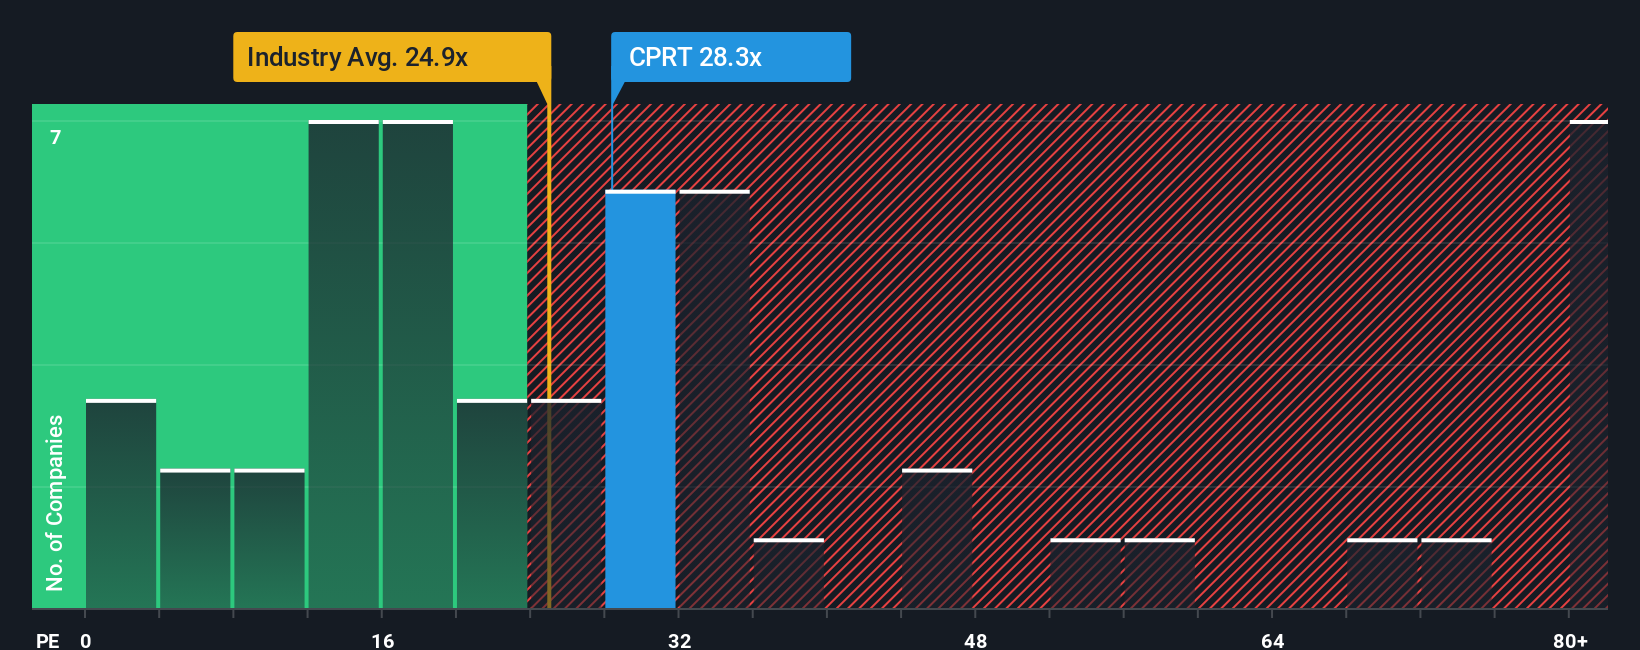
Copart currently trades on a P/E of 23.99x, compared with the Commercial Services industry average of about 25.09x and a peer average of 39.77x. Simply Wall St’s Fair Ratio for Copart is 27.58x. The Fair Ratio is a proprietary estimate of what Copart’s P/E might be given its earnings growth profile, industry, profit margins, market cap and risk characteristics.
This Fair Ratio can be more informative than a simple industry or peer comparison because it adjusts for factors specific to Copart rather than assuming all companies deserve the same rating. On this basis, Copart’s current P/E sits below its Fair Ratio, which indicates that the shares may be undervalued on this metric.
Result: UNDERVALUED
P/E ratios tell one story, but what if the real opportunity lies elsewhere? Start investing in legacies, not executives. Discover our 22 top founder-led companies.
Upgrade Your Decision Making: Choose your Copart Narrative
Earlier we mentioned that there is an even better way to understand valuation, so let us introduce you to Narratives, a simple tool on Simply Wall St’s Community page where you connect your view of Copart’s story to concrete forecasts for revenue, earnings and margins. These then flow through to a Fair Value that you can compare with the current share price, update automatically when new news or earnings arrive, and tailor to your own perspective, whether you lean closer to a more cautious view that sees Fair Value around US$33 or a more optimistic view closer to US$65, all on a platform used by millions of investors.
For Copart however we will make it really easy for you with previews of two leading Copart Narratives:
Fair value: US$48.89
Implied discount to this fair value: 19.2% undervalued versus the last close of US$39.51
Revenue growth assumption: 7.51% per year
- Analysts build a case around international expansion, digital auction tools and Copart’s role in vehicle recycling, which together support higher unit volumes and potential new revenue streams.
- They assume revenue grows by 11.1% a year for the next 3 years, margins edge up from 33.4% to 33.7%, and earnings reach US$2.1b by around September 2028.
- To line up with this view, you would need to be comfortable with Copart trading on a P/E of 31.5x those 2028 earnings and accept the risks around safety technology, insurance coverage, costs, competition and reliance on large insurers.
Fair value: US$33.00
Implied premium to this fair value: 19.7% overvalued versus the last close of US$39.51
Revenue growth assumption: 5.16% per year
- The cautious view leans on slower expected revenue growth, a heavier fixed cost base from past yard and land spend and the possibility that uninsured vehicles and alternative channels limit long run auction volumes.
- In this case, bearish analysts model revenue growing 5.2% a year, margins rising from 34.2% to 34.9% and earnings reaching US$1.9b by about December 2028, with a lower 20.8x P/E on those earnings.
- To agree with this stance, you would need to assume that the market is assigning too high a P/E today and that factors like safety tech, tariffs, buyer mix and exposure to noninsurance sellers cap Copart’s ability to grow into its current price.
If you want to see how other investors are framing the story around these numbers, Curious how numbers become stories that shape markets? Explore Community Narratives and compare where you sit between the bull and bear cases.
Do you think there's more to the story for Copart? Head over to our Community to see what others are saying!
This article by Simply Wall St is general in nature. We provide commentary based on historical data and analyst forecasts only using an unbiased methodology and our articles are not intended to be financial advice. It does not constitute a recommendation to buy or sell any stock, and does not take account of your objectives, or your financial situation. We aim to bring you long-term focused analysis driven by fundamental data. Note that our analysis may not factor in the latest price-sensitive company announcements or qualitative material. Simply Wall St has no position in any stocks mentioned.