Is CoreWeave (CRWV) Pricing Reflect Its Recent Share Price Weakness And Mixed Valuation Signals
CoreWeave, Inc. Class A CRWV | 82.24 | +4.84% |
- If you are wondering whether CoreWeave's current share price makes sense, this article walks through what the numbers suggest about where value might and might not be showing up.
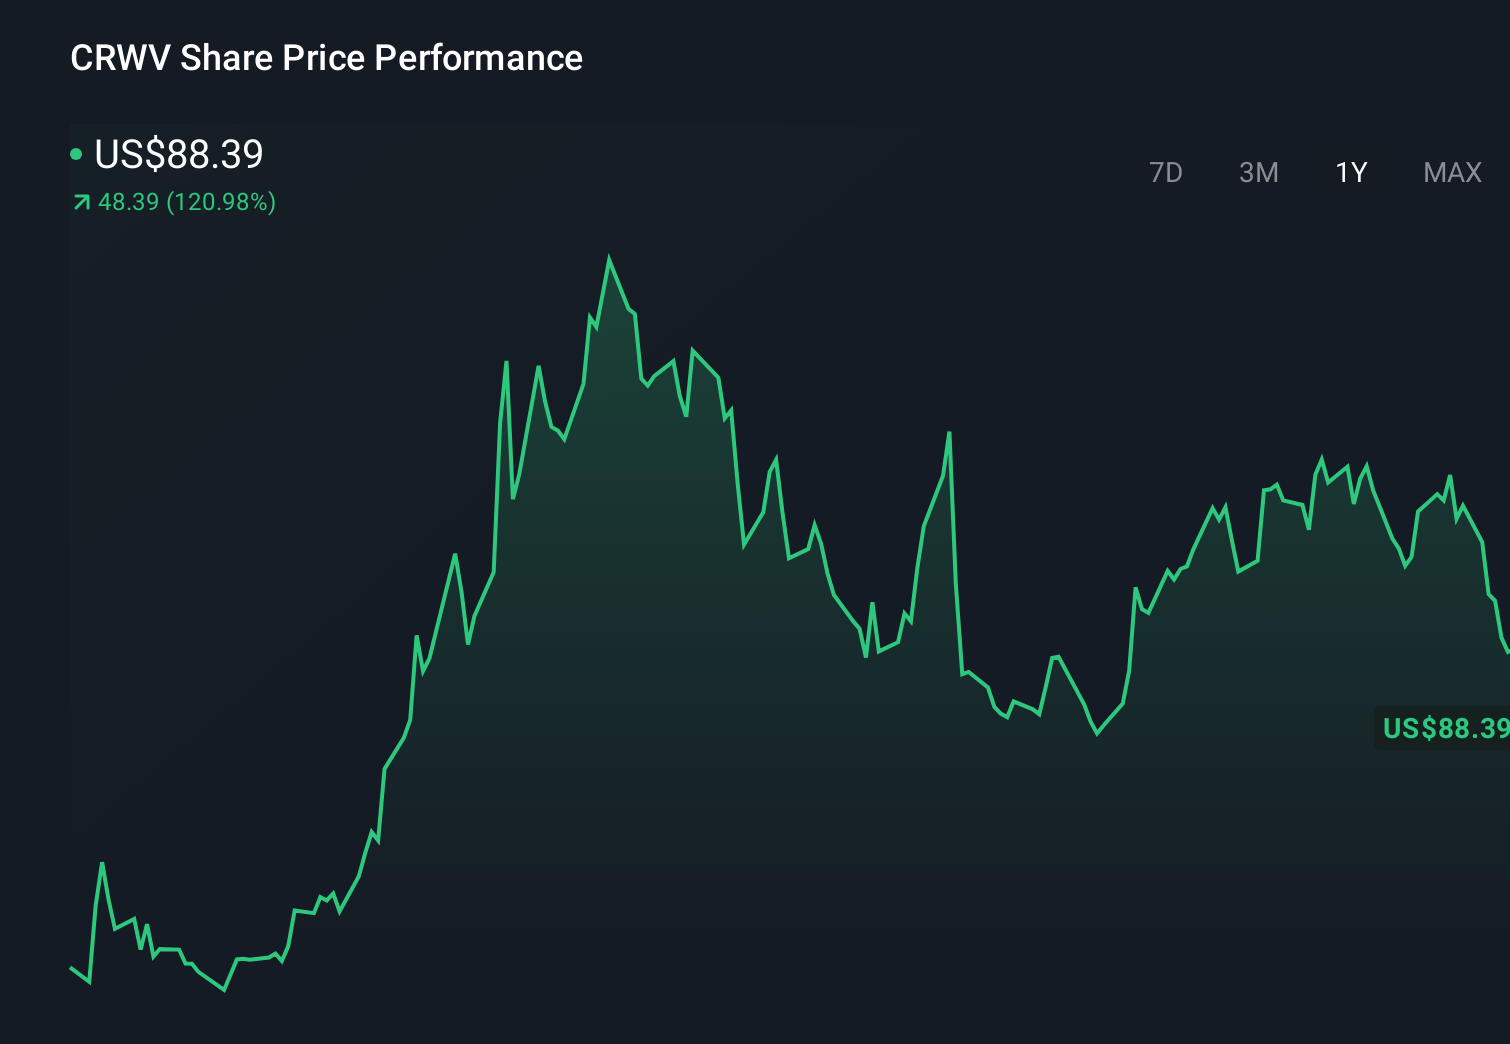
- The stock last closed at US$88.94, with a 7 day return of 9.5% decline and a 30 day and year to date return of 12.1%, which already hints at shifting views on its risks and potential.
- Recent coverage has focused on CoreWeave's role as a cloud and AI infrastructure provider, with attention on its position in GPU focused workloads and data center capacity. This helps explain why sentiment can move quickly. Commentators have also highlighted its relationships with large ecosystem partners and customers, giving investors more to weigh when they look at short term price swings.
- On our simple 6 check valuation framework, CoreWeave scores a 2 out of 6. We will look at how different methods like DCFs and multiples line up with that score, and then finish with a way to tie these valuation tools together into a clearer story by the end of the article.
CoreWeave scores just 2/6 on our valuation checks. See what other red flags we found in the full valuation breakdown.
Approach 1: CoreWeave Discounted Cash Flow (DCF) Analysis
A DCF model projects a company’s future cash flows and discounts them back to today to estimate what the entire business might be worth right now, then translates that into a value per share.
For CoreWeave, the model used is a 2 Stage Free Cash Flow to Equity approach, based on cash flow projections in $. The latest twelve month free cash flow is a loss of about $12.0 million. Analyst inputs and further extrapolations point to free cash flow of $1.203 million in 2030, with interim projections that move from larger losses in 2026 and 2027 to positive cash flows from 2030 onward.
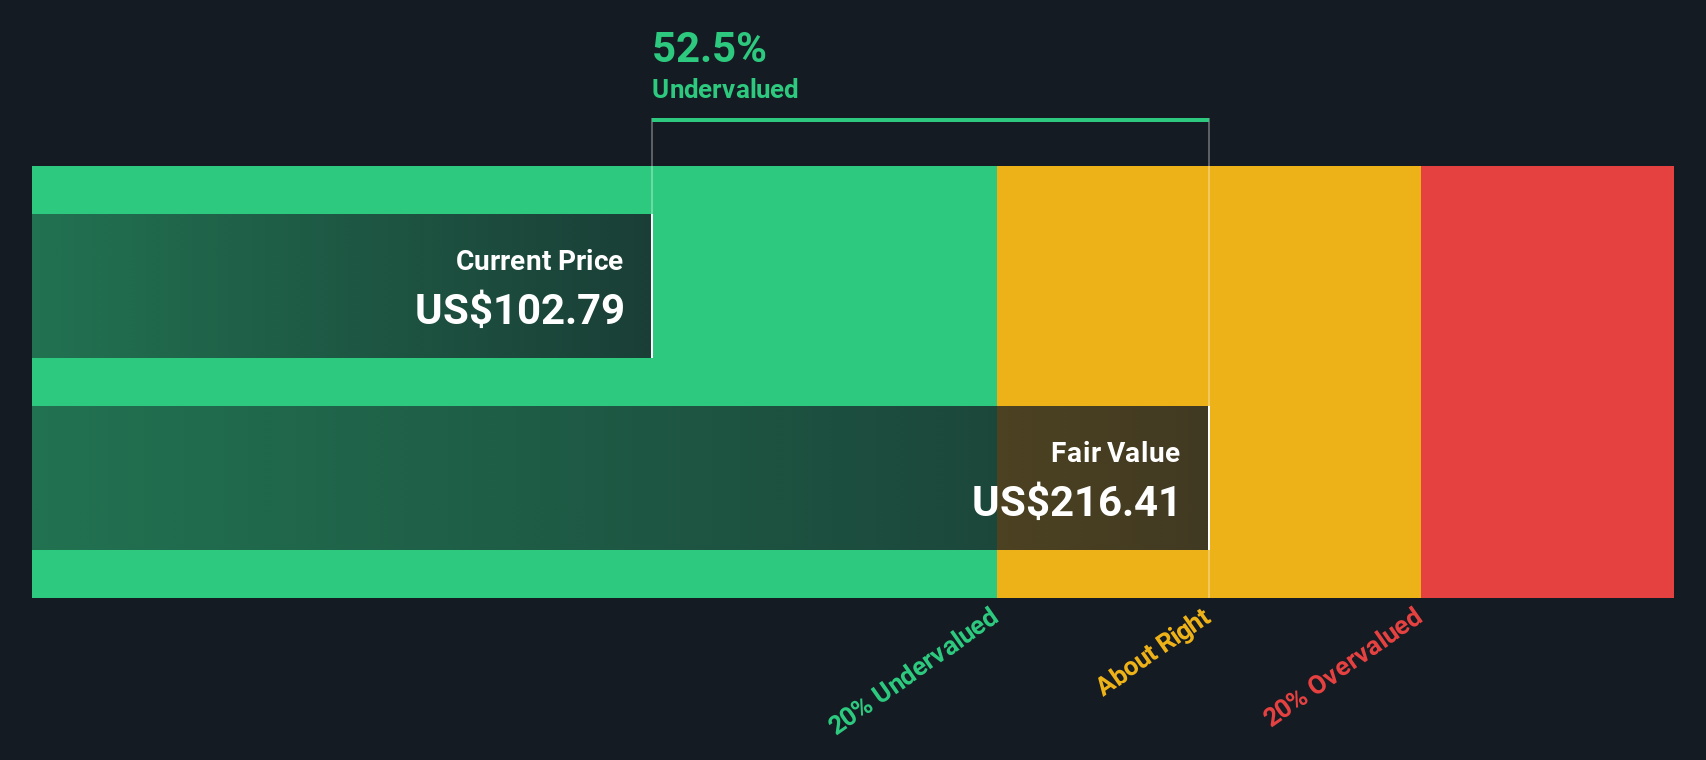
When all those projected cash flows are discounted back to today, the model arrives at an estimated intrinsic value of about $33.43 per share. Compared with the recent share price of US$88.94, this implies the stock is described as 166.0% overvalued under this specific DCF setup.
Result: OVERVALUED
Our Discounted Cash Flow (DCF) analysis suggests CoreWeave may be overvalued by 166.0%. Discover 878 undervalued stocks or create your own screener to find better value opportunities.
Approach 2: CoreWeave Price vs Sales
For companies that are still loss making or early in their profitability journey, P/S is often more useful than P/E because revenue is less affected by accounting choices and short term swings in earnings. Investors usually accept a higher P/S ratio when they expect stronger growth and lower perceived risk, while slower growth or higher uncertainty tend to justify a lower, more conservative range.
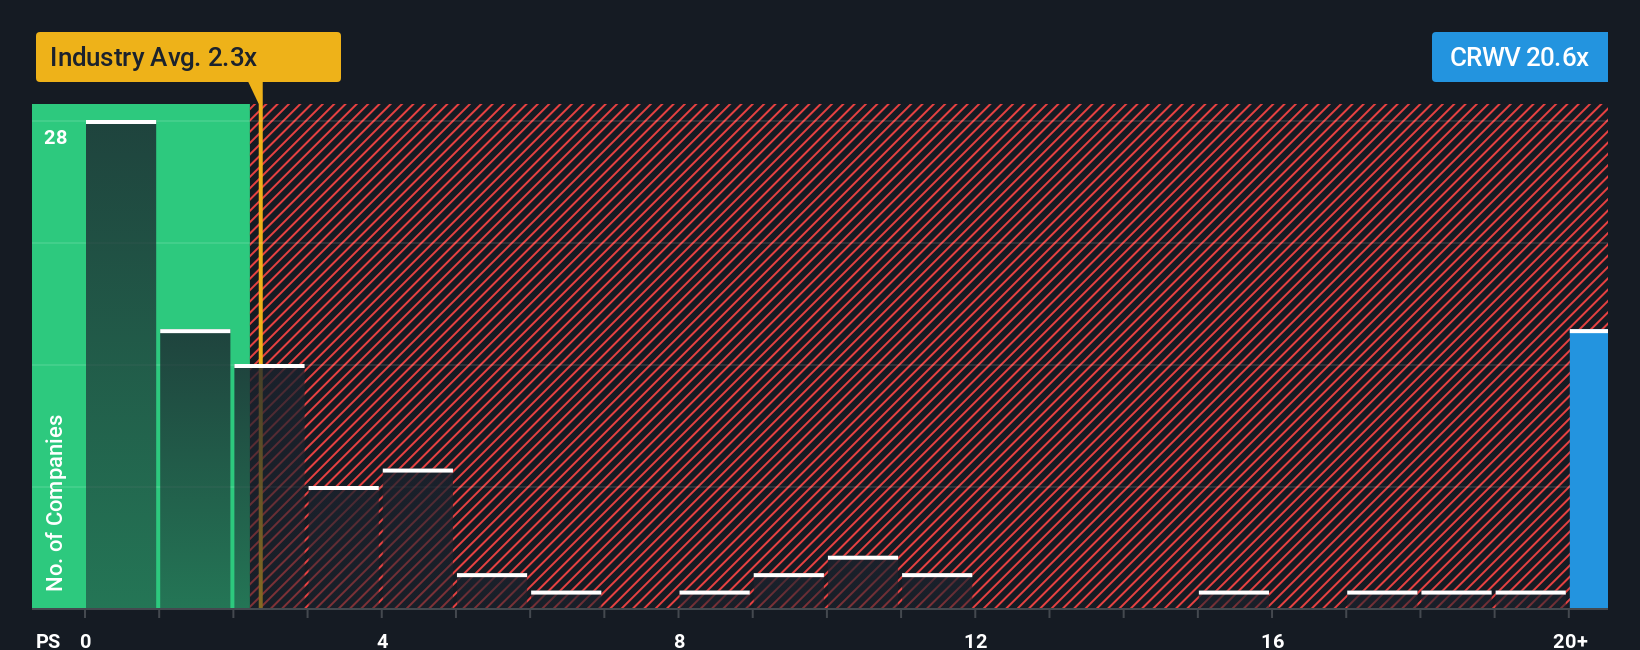
CoreWeave currently trades on a P/S ratio of 10.77x. That sits well above the broader IT industry average of 2.23x, but below the peer group average of 24.13x. To add more context, Simply Wall St calculates a proprietary “Fair Ratio” for CoreWeave of 27.55x. This is an estimate of what P/S might look like after considering factors such as earnings growth, industry, profit margin, market cap and specific risks, rather than relying only on simple peer or industry comparisons.
Because the Fair Ratio of 27.55x is higher than the current 10.77x, this framework suggests the shares are trading below the level implied by those fundamentals on a P/S basis.
Result: UNDERVALUED
P/S ratios tell one story, but what if the real opportunity lies elsewhere? Discover 1425 companies where insiders are betting big on explosive growth.
Upgrade Your Decision Making: Choose your CoreWeave Narrative
Earlier we mentioned that there is an even better way to understand valuation, so let us introduce you to Narratives, which are simply your story about a company linked directly to your numbers for fair value, revenue, earnings and margins. A Narrative connects what you believe about CoreWeave’s business to a clear financial forecast, then turns that into an estimated fair value that you can compare with the current share price to help you decide whether you see room to buy, hold or sell. On Simply Wall St, millions of investors build and view these Narratives on the Community page, where the tool is designed to be straightforward to adjust as your views change. Because Narratives update automatically when new information such as results or major news is added to the platform, the story and the numbers stay aligned for you over time. For example, one CoreWeave Narrative on the Community page might assume a much higher fair value and stronger long term estimates than another Narrative that is based on far more conservative expectations for the business.
Do you think there's more to the story for CoreWeave? Head over to our Community to see what others are saying!
This article by Simply Wall St is general in nature. We provide commentary based on historical data and analyst forecasts only using an unbiased methodology and our articles are not intended to be financial advice. It does not constitute a recommendation to buy or sell any stock, and does not take account of your objectives, or your financial situation. We aim to bring you long-term focused analysis driven by fundamental data. Note that our analysis may not factor in the latest price-sensitive company announcements or qualitative material. Simply Wall St has no position in any stocks mentioned.