Is Corpay (CPAY) Pricing Look Attractive After Mixed Returns And Conflicting Valuation Signals
Corpay, Inc. CPAY | 306.57 306.57 | +0.87% 0.00% Pre |
- If you are asking yourself whether Corpay at around US$320 per share is a bargain or just fairly priced, you are in the right place.
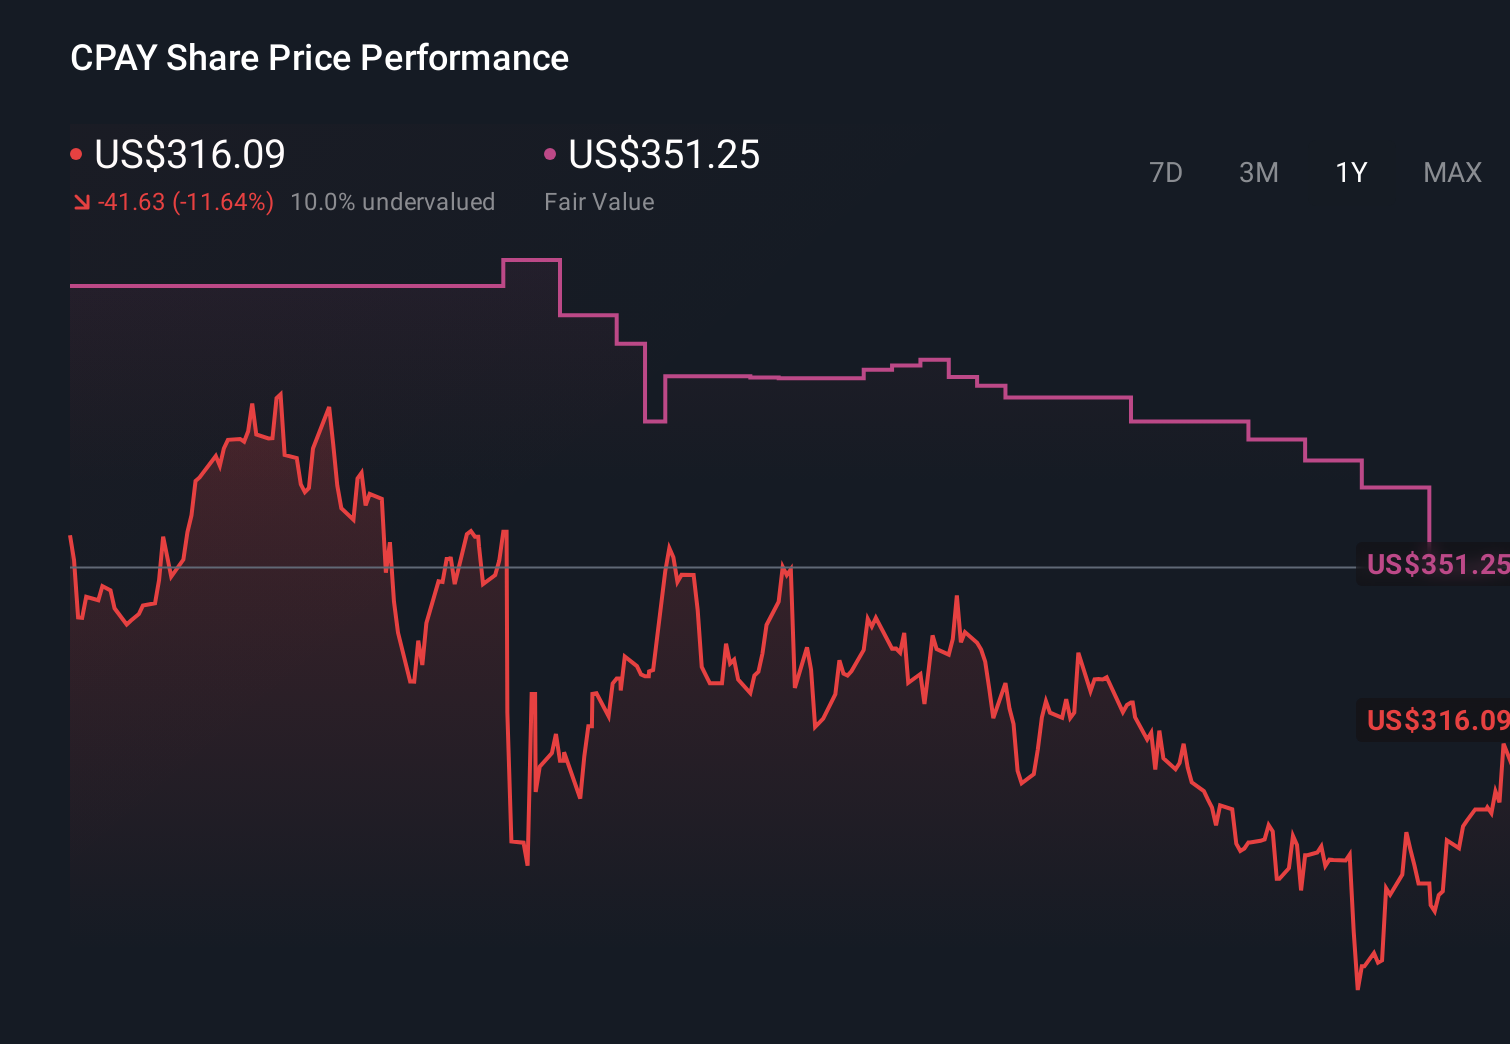
- The stock has been relatively flat over the last 7 days, up 3.3% over 30 days, 6.6% year to date, but with a 15.5% decline over 1 year and a 56.8% gain over 3 years, which gives a mixed picture for recent returns and risk.
- These moves have played out against ongoing interest in the diversified financials space and Corpay's role in corporate payments and related services. Recent coverage has focused on how investors are weighing that profile against broader market conditions and changing expectations for financial stocks.
- Corpay currently has a valuation score of 3 out of 6, which reflects the number of checks where it appears undervalued. Next, we will compare what different valuation approaches say about that score before finishing with a way to pull all of those signals together more effectively.
Approach 1: Corpay Excess Returns Analysis
The Excess Returns model looks at how much profit a company is expected to generate over and above the return that shareholders require, then adds that to the current value of its equity base. It is essentially asking how effectively each dollar of book value might be used over time.
For Corpay, the model starts with a Book Value of $58.19 per share and a Stable Book Value estimate of $88.93 per share, based on weighted future book value estimates from 4 analysts. On the earnings side, Stable EPS is set at $27.58 per share, sourced from weighted future return on equity estimates from 4 analysts, with an Average Return on Equity of 31.02%.
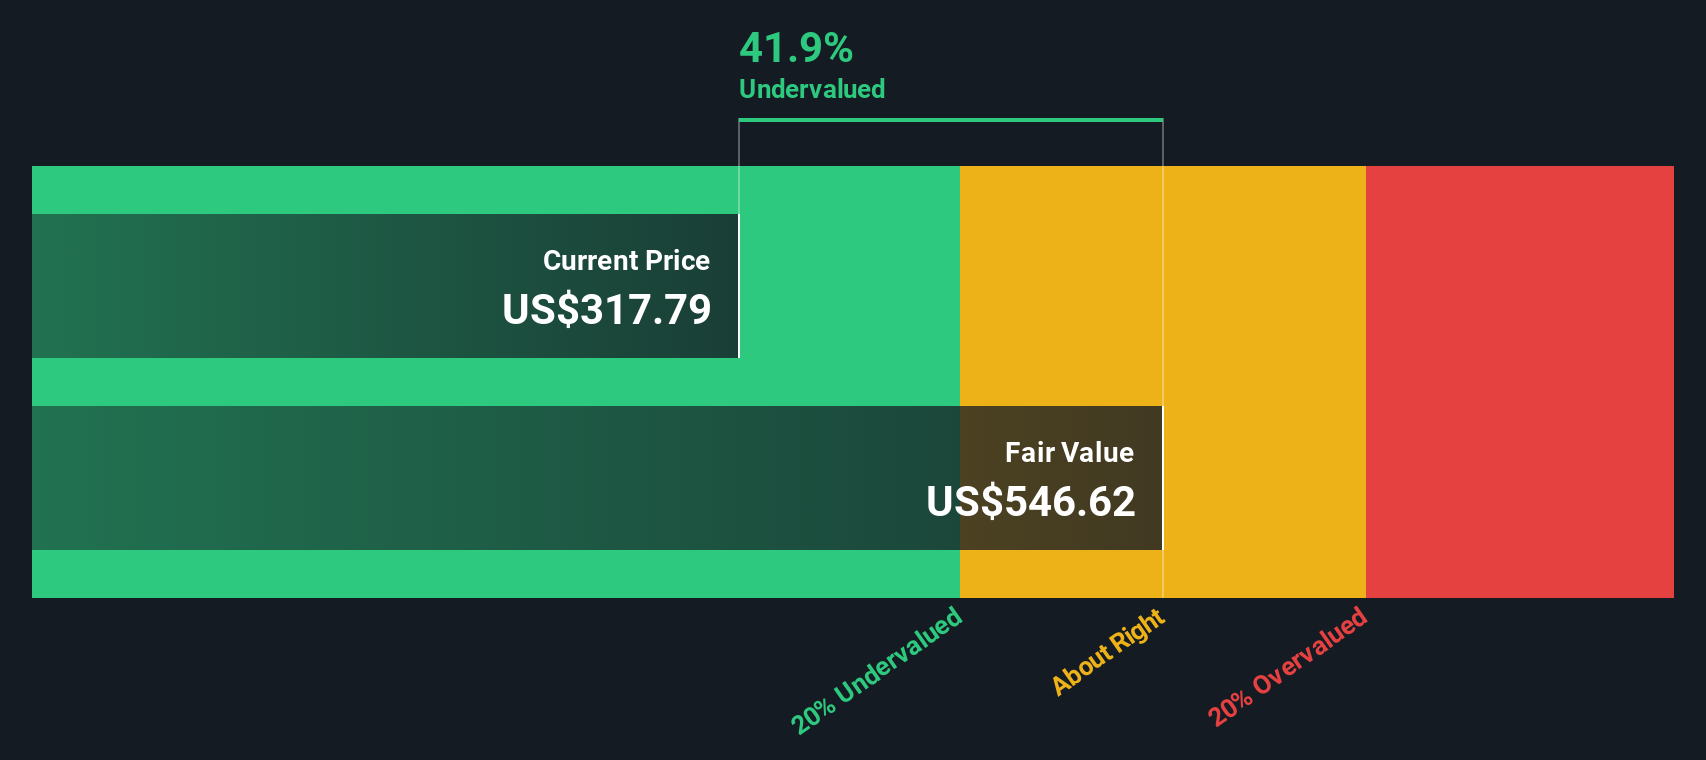
The required return for shareholders, or Cost of Equity, is $7.17 per share. That leaves an estimated Excess Return of $20.41 per share, which is what this model treats as value created beyond the cost of capital. Combining these inputs, the Excess Returns valuation points to an intrinsic value of about $513.58 per share.
Against the current share price of around $320, this implies the stock is about 37.6% undervalued.
Result: UNDERVALUED
Our Excess Returns analysis suggests Corpay is undervalued by 37.6%. Track this in your watchlist or portfolio, or discover 872 more undervalued stocks based on cash flows.
Approach 2: Corpay Price vs Earnings
For a profitable company like Corpay, the P/E ratio is a useful way to check how much you are paying for each dollar of earnings. It links directly to what the business is currently generating, so it is a familiar, earnings focused cross check against the DCF result you just saw.
What counts as a “normal” P/E depends on how the market views a company’s growth prospects and risk. Higher expected growth and lower perceived risk can justify a higher P/E, while slower growth or higher risk usually point to a lower multiple as being more sensible.
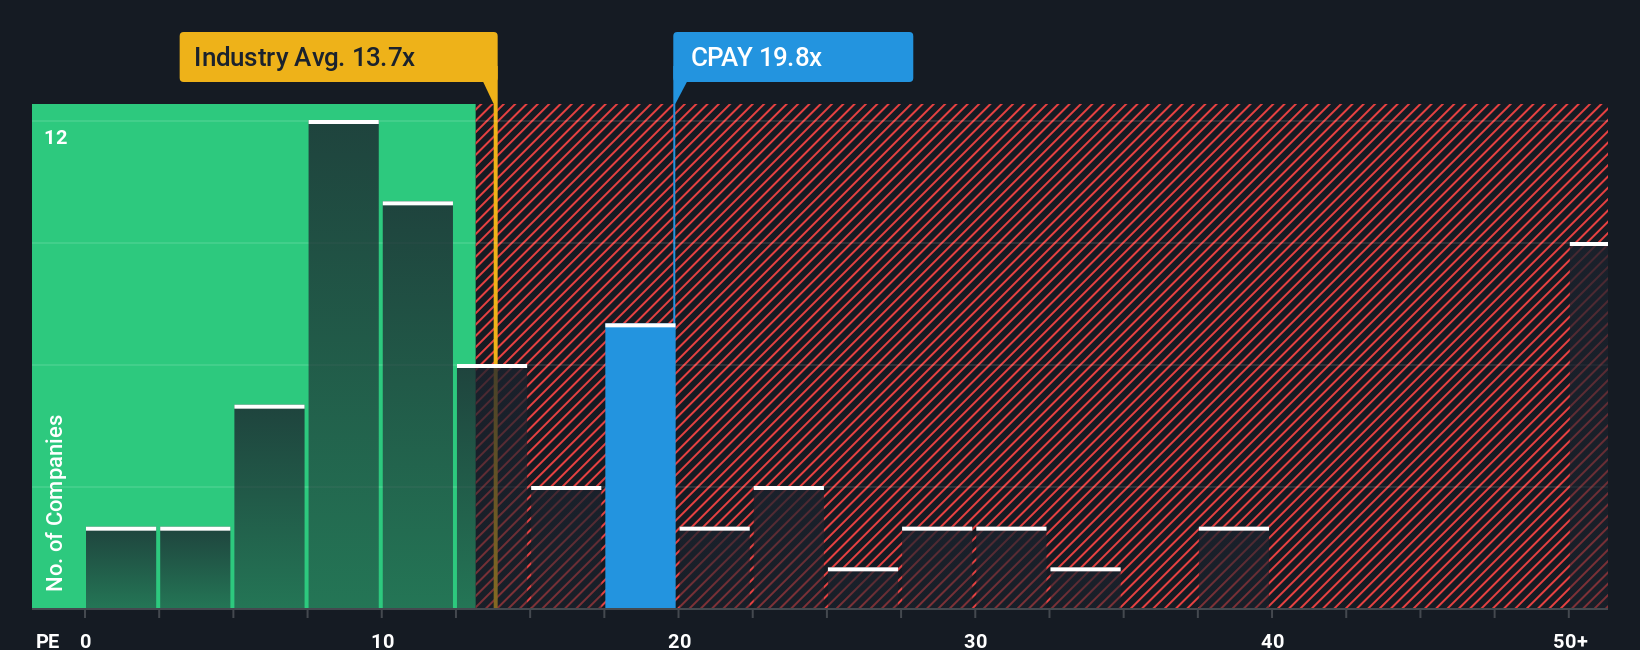
Corpay currently trades on a P/E of 21.33x. That sits above the Diversified Financial industry average of 14.48x and below the peer group average of 56.96x, so simple comparisons send a mixed signal. Simply Wall St’s Fair Ratio for Corpay is 19.21x, which is its proprietary view of what a reasonable P/E might be after considering factors like earnings growth, profit margins, industry, market cap and company specific risks. Because this Fair Ratio is tailored to Corpay, it can be more informative than broad peer or industry averages. Comparing 21.33x with the 19.21x Fair Ratio points to Corpay trading somewhat above that tailored level.
Result: OVERVALUED
P/E ratios tell one story, but what if the real opportunity lies elsewhere? Discover 1427 companies where insiders are betting big on explosive growth.
Upgrade Your Decision Making: Choose your Corpay Narrative
Earlier we mentioned that there is an even better way to think about valuation, so let us introduce you to Narratives, which is Simply Wall St’s way of letting you attach a clear story to your numbers, including your own fair value, revenue, earnings and margin assumptions for Corpay.
A Narrative connects three things: what you believe about the business, the financial forecast that follows from that belief, and the fair value that drops out at the end, so you can see the logic from story to numbers to price.
On Simply Wall St’s Community page, used by millions of investors, Narratives are set up so you can quickly compare your fair value to the current share price and decide whether Corpay looks more like a hold, a potential buy, or something you might consider selling.
Each Narrative is refreshed when new information appears, such as earnings updates or major news. For Corpay you might see one investor’s Narrative pointing to a fair value well above the current price while another has a fair value well below it, reflecting very different assumptions about its future.
Do you think there's more to the story for Corpay? Head over to our Community to see what others are saying!
This article by Simply Wall St is general in nature. We provide commentary based on historical data and analyst forecasts only using an unbiased methodology and our articles are not intended to be financial advice. It does not constitute a recommendation to buy or sell any stock, and does not take account of your objectives, or your financial situation. We aim to bring you long-term focused analysis driven by fundamental data. Note that our analysis may not factor in the latest price-sensitive company announcements or qualitative material. Simply Wall St has no position in any stocks mentioned.