

Is Crane (CR) Still Attractive After A 34% Yearly Surge And Rich P/E Multiple
Crane Company CR | 0.00 |
- Wondering if Crane is still good value after a strong run, or if the price already reflects most of the upside? This article focuses squarely on what you are paying for compared to what you are getting.
- Crane shares last closed at US$188.46, with returns of 12.2% over 7 days, 10.1% over 30 days, 0.5% year to date, 34.4% over 1 year, 139.8% over 3 years, and 225.1% over 5 years.
- Recent coverage around Crane has focused on its position in capital goods, portfolio composition and how investors are thinking about future demand, which helps frame these strong multi period returns. These themes give helpful context for judging whether current expectations built into the share price look cautious or optimistic.
- On Simply Wall St's valuation checks, Crane scores 1 out of 6 for being undervalued. That low score, visible in the valuation summary, sets up a closer look at common methods like DCF and multiples, along with a more holistic way of thinking about value at the end of the article.
Crane scores just 1/6 on our valuation checks. See what other red flags we found in the full valuation breakdown.
Approach 1: Crane Discounted Cash Flow (DCF) Analysis
A Discounted Cash Flow, or DCF, model estimates what a business could be worth by projecting its future cash flows and then discounting those amounts back to today using a required return. It is essentially asking what all those future dollars are worth in present terms.
For Crane, the model uses a 2 Stage Free Cash Flow to Equity approach. The latest twelve month free cash flow is about $347.6 million. Analysts provide forecasts out to 2030, and those figures are then extended further by Simply Wall St. Within this, projected free cash flow for 2030 is $620.2 million, with interim years such as 2026 and 2027 at $341.2 million and $440.8 million respectively, all in dollars. These projected cash flows are then discounted. For example, the 2026 and 2030 discounted values are $314.3 million and $411.3 million.
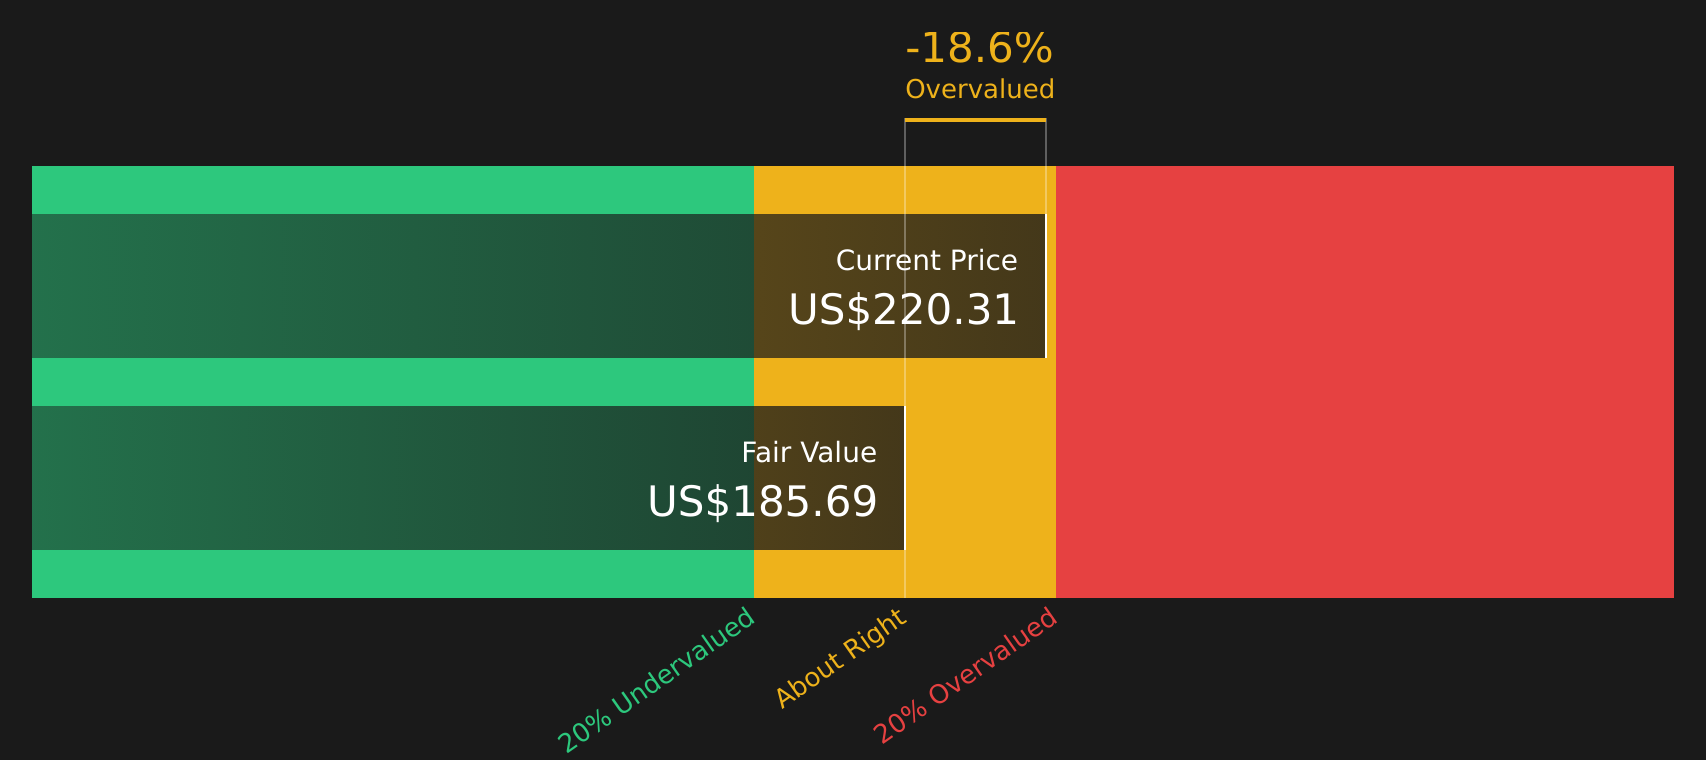
Putting this together, the DCF model produces an estimated intrinsic value of about $189.65 per share. Compared to the recent share price of $188.46, the implied discount is around 0.6%, which points to Crane trading very close to this cash flow based estimate.
Result: ABOUT RIGHT
Crane is fairly valued according to our Discounted Cash Flow (DCF), but this can change at a moment's notice. Track the value in your watchlist or portfolio and be alerted on when to act.
Approach 2: Crane Price vs Earnings
For a profitable company like Crane, the P/E ratio is a straightforward way to see what you are paying for each dollar of current earnings. Investors usually accept a higher P/E when they expect stronger growth or see the business as lower risk, and a lower P/E when growth expectations or perceived risks are higher.
Crane currently trades on a P/E of 32.81x. That sits above the Machinery industry average P/E of about 27.89x and slightly above the peer group average of 31.91x. This signals that the market is placing a relatively higher value on Crane's earnings compared with many of its listed Machinery peers.
Simply Wall St's Fair Ratio for Crane is 24.82x. This is a proprietary estimate of what the P/E might be given factors such as earnings growth, profit margins, industry, market cap and company specific risks. Because it blends these elements together, the Fair Ratio can often be a more tailored yardstick than a simple comparison with industry or peer averages.
Comparing Crane's current P/E of 32.81x with the Fair Ratio of 24.82x indicates that the shares are trading above this model based assessment.
Result: OVERVALUED

P/E ratios tell one story, but what if the real opportunity lies elsewhere? Start investing in legacies, not executives. Discover our 18 top founder-led companies.
Upgrade Your Decision Making: Choose your Crane Narrative
Earlier it was mentioned that there is an even better way to understand valuation. Narratives bring this to life by letting you set out a clear story for Crane, link that story to your own revenue, earnings and margin assumptions, turn those into a Fair Value that sits next to the live share price on Simply Wall St's Community page, and then keep that view fresh as new earnings or news arrive. This is why some investors currently lean toward a more cautious Crane Narrative with a Fair Value around US$185.88, while others lean toward a more optimistic Crane Narrative closer to US$238, all within the same easy tool.
For Crane, here are previews of two leading Crane Narratives to help you compare the different perspectives:
Bull Narrative
Fair Value: US$238.00
Implied discount to this Fair Value: 20.8% undervalued based on the latest close.
Revenue growth assumption: 12.55% a year.
- Focus on higher growth, higher margin verticals such as chemicals, pharma, wastewater and cryogenics, supported by ongoing R&D and targeted acquisitions.
- Bullish analysts model rising profit margins and a higher future P/E multiple, which together form the basis of the US$238.00 Fair Value estimate.
- Key risks include lower portfolio diversification, intense global competition, potential product obsolescence and higher compliance costs that could pressure margins and cash flows.
Bear Narrative
Fair Value: US$185.88
Implied premium to this Fair Value: 1.4% overvalued based on the latest close.
Revenue growth assumption: 11.68% a year.
- Bearish analysts highlight exposure to decarbonization trends, automation shifts and stronger competitors that could limit growth in more traditional industrial segments.
- The US$185.88 Fair Value is based on slightly lower margin and P/E assumptions, along with concerns around execution on acquisitions and exposure to cyclical end markets.
- Upside risks to this cautious view include a strong balance sheet, sizeable M&A capacity and potential margin benefits if productivity and pricing initiatives continue to gain traction.
If you want to see how other investors are weighing these bullish and bearish storylines side by side, you can explore the full range of community views for Crane via the See what the community is saying about Crane.
Do you think there's more to the story for Crane? Head over to our Community to see what others are saying!

This article by Simply Wall St is general in nature. We provide commentary based on historical data and analyst forecasts only using an unbiased methodology and our articles are not intended to be financial advice. It does not constitute a recommendation to buy or sell any stock, and does not take account of your objectives, or your financial situation. We aim to bring you long-term focused analysis driven by fundamental data. Note that our analysis may not factor in the latest price-sensitive company announcements or qualitative material. Simply Wall St has no position in any stocks mentioned.