Is Credicorp (NYSE:BAP) Still Attractive After A 96% One Year Share Price Surge
Credicorp Ltd. BAP | 339.98 | -0.38% |
- If you are wondering whether Credicorp's current share price still offers value, you are not alone; the stock has attracted a lot of attention from investors looking for bank exposure in Latin America.
- The shares recently closed at US$353.30, with a 1% decline over the last week, but a 20.3% return over the last 30 days and a 96.2% return over the last year that has put longer term holders in focus.
- Recent market interest has been shaped by ongoing discussions around regional banking conditions and investor appetite for financials, which often affects sentiment toward Credicorp. Broader news on regulatory developments and capital flows into Peru and neighboring markets has also helped frame how investors think about the risk and return profile of the group.
- On our checks, Credicorp has a valuation score of 4/6. This sets up a closer look at how traditional tools like P/E, P/B and discounted cash flow models stack up, and hints at an even richer way to think about valuation that we will come back to at the end.
Approach 1: Credicorp Excess Returns Analysis
The Excess Returns model looks at how much profit Credicorp can generate above the return that shareholders typically require, and then capitalizes that surplus into an intrinsic value per share.
Here, the starting point is Credicorp's Book Value of US$460.65 per share and a Stable Book Value of US$528.42 per share, based on weighted future estimates from 6 analysts. On those assets, analysts see Stable EPS of US$104.77 per share, sourced from return on equity estimates from 8 analysts. That implies an Average Return on Equity of 19.83%.
The model also applies a Cost of Equity of US$44.65 per share, which leads to an Excess Return of US$60.11 per share. Simply Wall St rolls these excess returns forward and discounts them back to arrive at an intrinsic value of about US$512.16 per share.
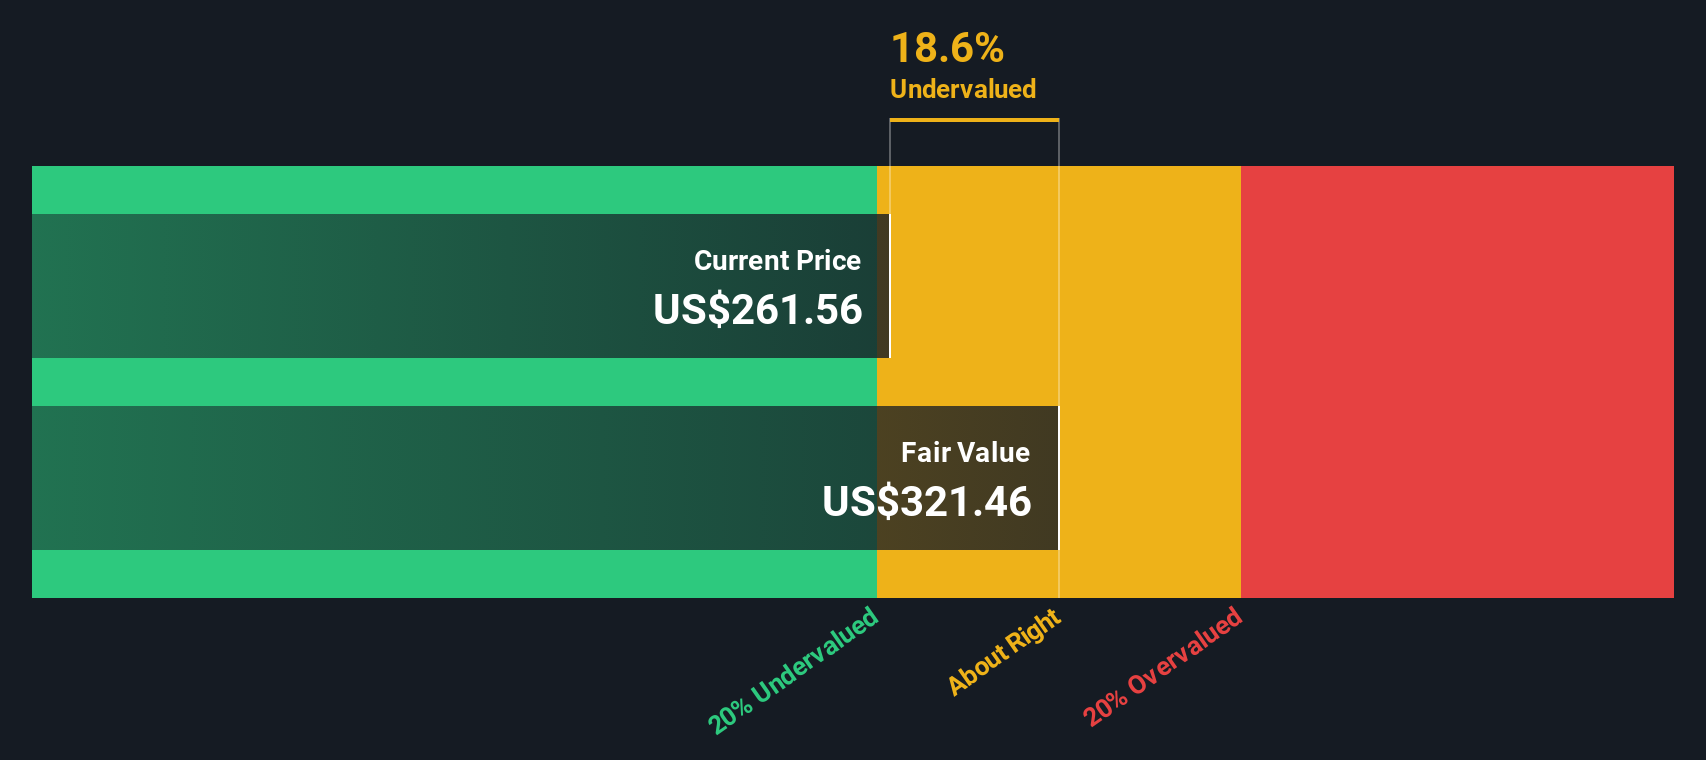
Compared with the recent share price of US$353.30, this Excess Returns valuation points to an implied discount of roughly 31.0%. This indicates that Credicorp may be trading below this estimate of intrinsic value.
Result: UNDERVALUED
Our Excess Returns analysis suggests Credicorp is undervalued by 31.0%. Track this in your watchlist or portfolio, or discover 53 more high quality undervalued stocks.
Approach 2: Credicorp Price vs Earnings
For a profitable bank like Credicorp, the P/E ratio is a straightforward way to connect what you pay for the shares with the earnings the business is currently generating. It helps you see how many dollars investors are willing to pay today for each dollar of earnings.
What counts as a “normal” or “fair” P/E depends a lot on how investors see growth and risk. Higher expected growth or lower perceived risk can support a higher P/E, while slower growth or higher risk usually points to a lower P/E.
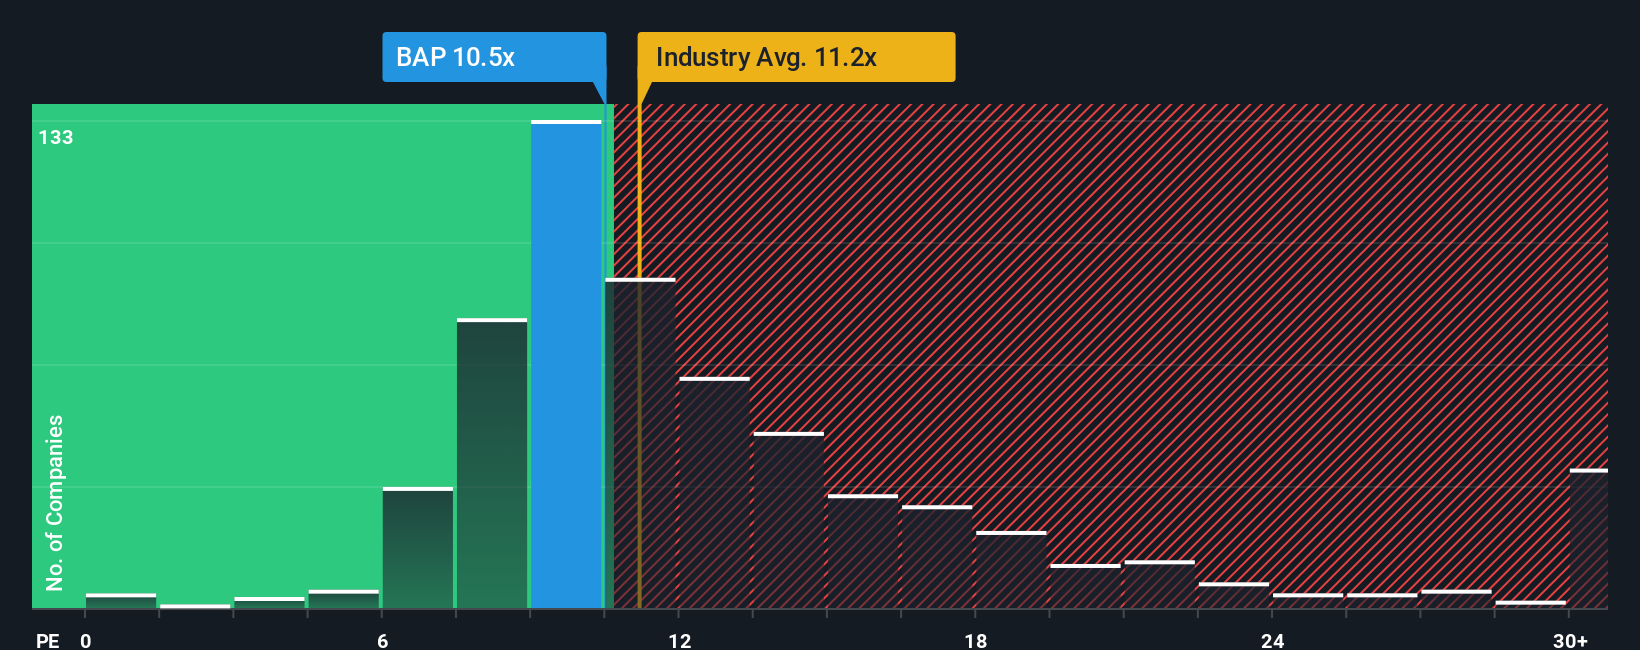
Credicorp currently trades on a P/E of 14.58x. That sits below its peer average of 14.76x and above the broader Banks industry average of 12.04x. Simply Wall St’s Fair Ratio for Credicorp is 14.63x. This Fair Ratio is a proprietary estimate of what P/E might be reasonable for the company, taking into account factors like its earnings growth profile, risk, profit margins, industry and market cap. Because it adjusts for these company specific characteristics, it can be more informative than a simple peer or industry comparison.
With the actual P/E of 14.58x sitting very close to the Fair Ratio of 14.63x, the shares appear to be priced roughly in line with this metric.
Result: ABOUT RIGHT
P/E ratios tell one story, but what if the real opportunity lies elsewhere? Start investing in legacies, not executives. Discover our 22 top founder-led companies.
Upgrade Your Decision Making: Choose your Credicorp Narrative
Earlier we mentioned that there is an even better way to understand valuation, so let us introduce you to Narratives. A Narrative is your story about Credicorp, where you link your view of its future revenue, earnings and margins to a simple financial forecast and, from there, to your own fair value. On Simply Wall St, millions of investors build and share these Narratives on the Community page, so you can see how different views line up with the same set of numbers. Narratives stay practical, because they help you decide what to do by comparing your Fair Value to the current share price. They also update automatically as new information, like news or earnings releases, feeds into the assumptions behind them. For example, one Credicorp Narrative might assume a relatively high fair value based on optimistic profitability, while another might set a much lower fair value based on more cautious expectations for future performance.
Do you think there's more to the story for Credicorp? Head over to our Community to see what others are saying!

This article by Simply Wall St is general in nature. We provide commentary based on historical data and analyst forecasts only using an unbiased methodology and our articles are not intended to be financial advice. It does not constitute a recommendation to buy or sell any stock, and does not take account of your objectives, or your financial situation. We aim to bring you long-term focused analysis driven by fundamental data. Note that our analysis may not factor in the latest price-sensitive company announcements or qualitative material. Simply Wall St has no position in any stocks mentioned.