Is Crescent Energy (CRGY) Now Attractive After A 22% Monthly Share Price Rebound?
Crescent Energy CRGY | 12.63 | +3.44% |
- If you are trying to figure out whether Crescent Energy at around US$10.23 is a bargain or a value trap, you are in the right place.
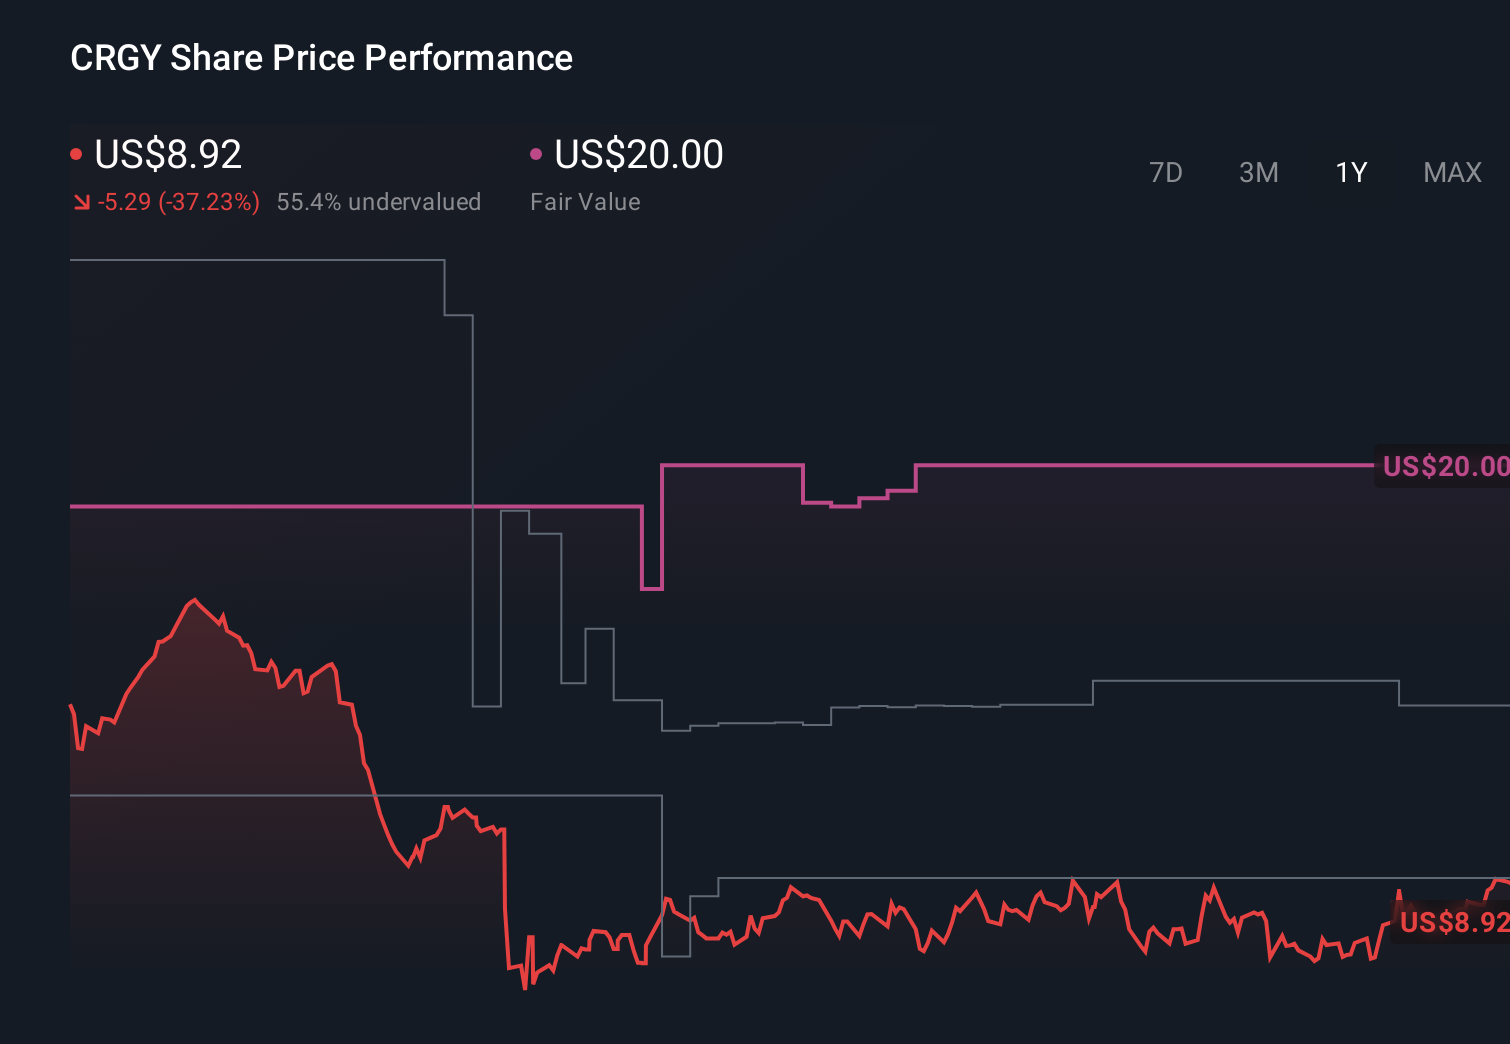
- The stock is up 22.1% over the last 30 days and 20.2% year to date, even though the 1 year return sits at a 27.6% decline and the 7 day move is a modest 0.7% decline.
- Recent news coverage has focused on Crescent Energy's position in the US energy sector and how its share price has been reacting to changes in investor sentiment toward oil and gas producers. Commentary has also highlighted how its trading level compares with peers and broader energy benchmarks, which helps put the recent moves into context.
- Crescent Energy currently has a valuation score of 3 out of 6. Next we will look at how different valuation approaches line up with that score, before finishing with an even more practical way to assess value for your own portfolio.
Approach 1: Crescent Energy Discounted Cash Flow (DCF) Analysis
A Discounted Cash Flow, or DCF, model estimates what a company could be worth today by projecting its future cash flows and then discounting those back to a present value.
For Crescent Energy, the model used is a 2 Stage Free Cash Flow to Equity approach. The latest twelve month free cash flow is a loss of $144.1 million. Looking ahead, analyst and extrapolated estimates point to projected free cash flow of $765.8 million in 2030, with annual projections between 2026 and 2035 ranging from roughly $703.3 million to $847.3 million, all in $.
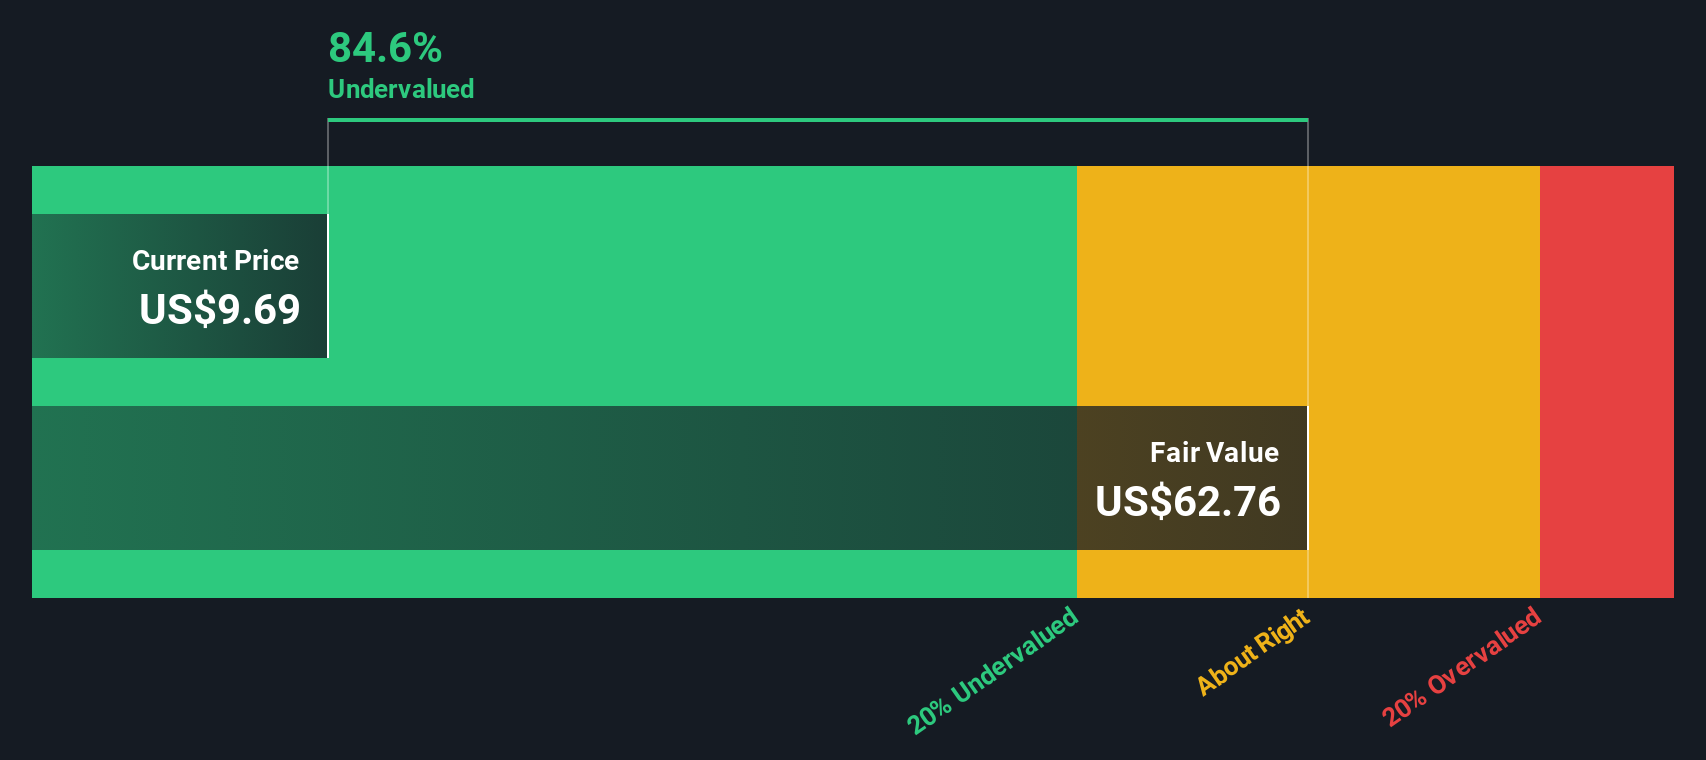
When these projected cash flows are discounted back, the model arrives at an estimated intrinsic value of about $41.47 per share. Against a recent share price of roughly $10.23, this indicates the stock is 75.3% undervalued according to this DCF approach.
Result: UNDERVALUED
Our Discounted Cash Flow (DCF) analysis suggests Crescent Energy is undervalued by 75.3%. Track this in your watchlist or portfolio, or discover 55 more high quality undervalued stocks.
Approach 2: Crescent Energy Price vs Earnings
For profitable companies, the P/E ratio is a straightforward way to see how much you are paying for each dollar of earnings, which is why it is often the first metric investors check. A higher or lower P/E can be reasonable depending on what the market expects for a company’s future growth and how risky those earnings are perceived to be.
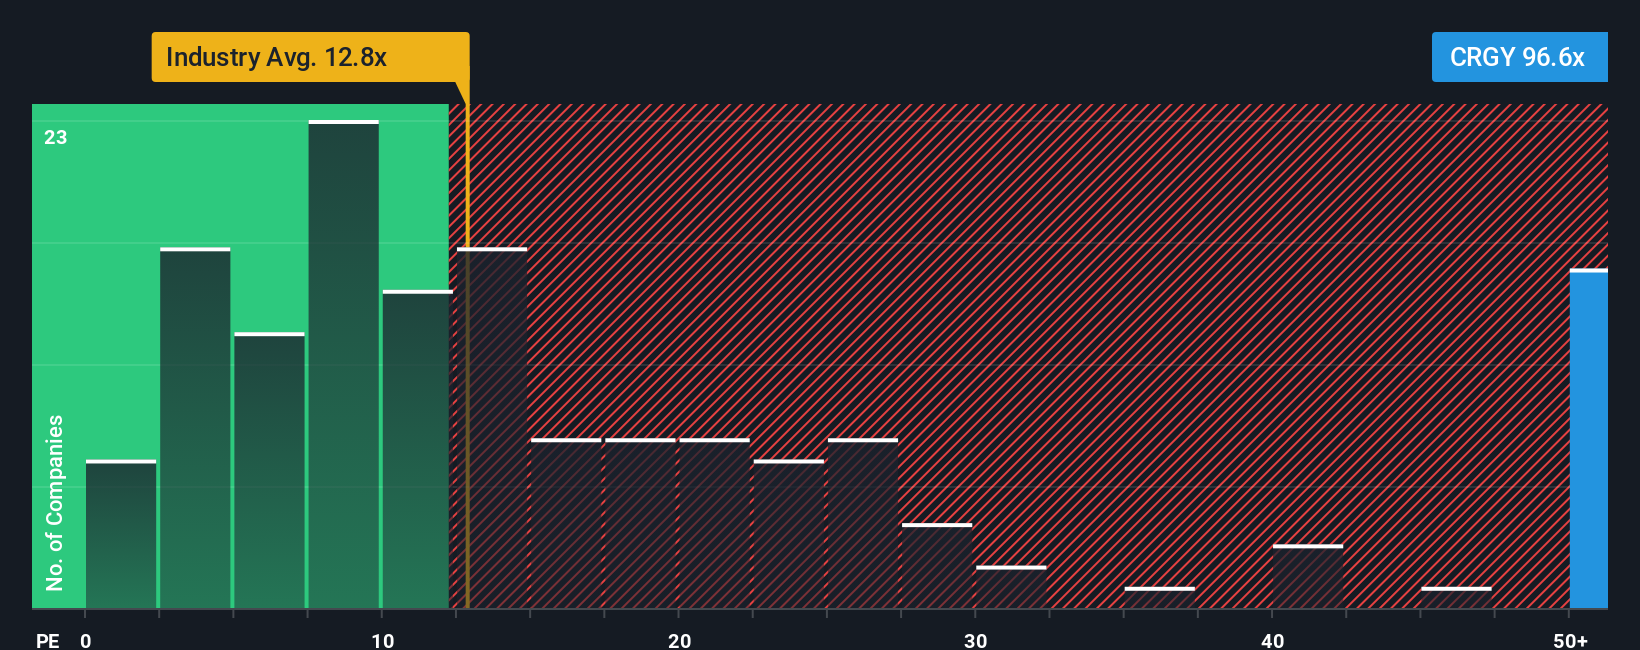
Crescent Energy currently trades on a P/E of about 139.9x. That is well above the Oil and Gas industry average of around 14.5x, and also above the peer group average of roughly 13.7x. On the face of it, that points to a rich valuation compared with both the wider industry and closer peers.
Simply Wall St’s Fair Ratio is a proprietary P/E level that reflects factors such as Crescent Energy’s earnings growth profile, industry, profit margins, market cap and risk characteristics. For Crescent Energy, this Fair Ratio is 21.3x. This is more tailored than a simple industry or peer comparison because it attempts to align the P/E with the company’s own fundamentals rather than broad group averages. Comparing the current P/E of 139.9x with the Fair Ratio of 21.3x suggests the shares trade well above what this framework would view as a fair level.
Result: OVERVALUED
P/E ratios tell one story, but what if the real opportunity lies elsewhere? Start investing in legacies, not executives. Discover our 23 top founder-led companies.
Upgrade Your Decision Making: Choose your Crescent Energy Narrative
Earlier we mentioned that there is an even better way to understand valuation, so let us introduce you to Narratives, which are simply the story you believe about a company, linked directly to your assumptions for revenue, earnings, margins and a fair value estimate.
On Simply Wall St, Narratives sit in the Community page and let you connect Crescent Energy’s story to a full financial forecast, then compare the fair value that drops out of that story with today’s share price. This can help you decide whether it might be closer to a buy, hold, or sell for you.
Narratives are not static. They update as new news, forecasts or earnings arrive, so your view on Crescent Energy can move in real time rather than being locked into a single DCF or P/E snapshot.
For Crescent Energy today, one investor on the more upbeat side might see a fair value close to US$16.00. Another, more cautious, view points to about US$12.00. Those two Narratives reflect very different expectations for things like future revenue growth, profit margins and the P/E the market could be willing to pay.
Do you think there's more to the story for Crescent Energy? Head over to our Community to see what others are saying!
This article by Simply Wall St is general in nature. We provide commentary based on historical data and analyst forecasts only using an unbiased methodology and our articles are not intended to be financial advice. It does not constitute a recommendation to buy or sell any stock, and does not take account of your objectives, or your financial situation. We aim to bring you long-term focused analysis driven by fundamental data. Note that our analysis may not factor in the latest price-sensitive company announcements or qualitative material. Simply Wall St has no position in any stocks mentioned.