Is Crocs (CROX) Pricing Reflecting Recent Brand Buzz And Valuation Signals?
Crocs, Inc. CROX | 101.20 | +0.98% |
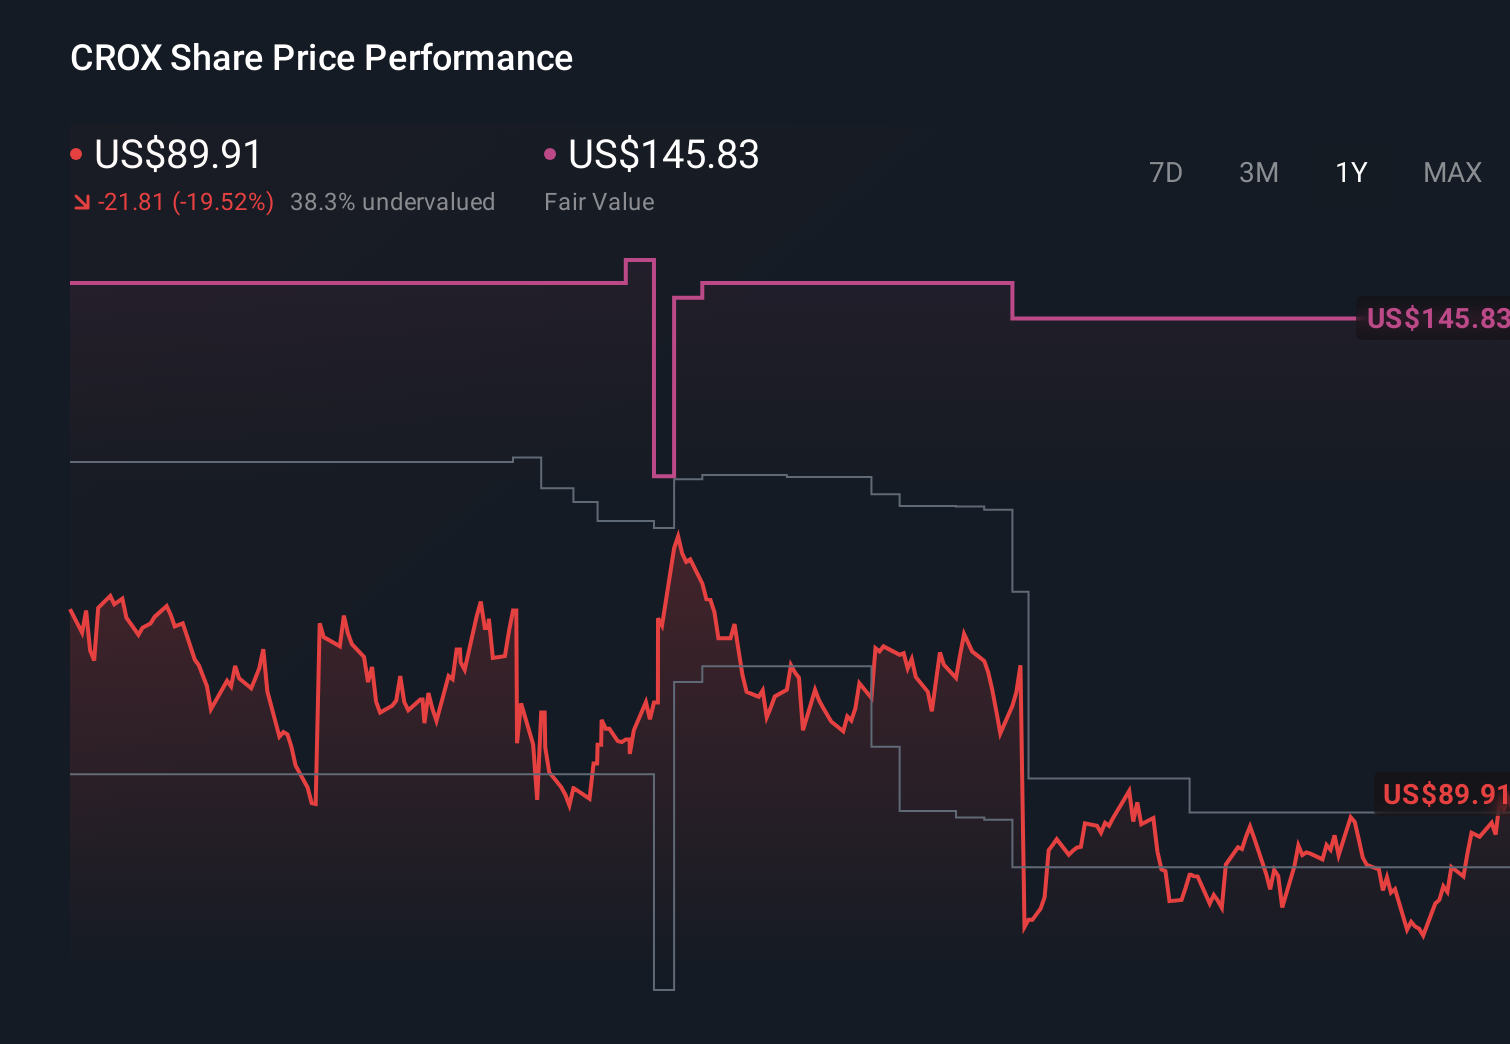
- If you are wondering whether Crocs at US$84.49 is attractively priced or potentially risky right now, this article will walk you through what the current price might be implying about the stock.
- The shares are up 2.4% over the last 7 days, while the 30-day return is a 5.2% decline and the 1-year return is an 11.5% decline, which may catch the eye of investors weighing short-term swings against longer-term returns.
- Recent news around Crocs has focused on the brand's positioning in casual footwear and how its product line continues to feature in consumer and retail discussions. This has helped frame the share price moves in terms of how the market views the durability of its brand and demand over time.
- On our valuation checklist, Crocs scores 3 out of 6 for being undervalued, giving it a value score of 3/6. Next, we will look at how different valuation methods compare, before circling back to an approach that can help you understand the story behind that number more clearly.
Approach 1: Crocs Discounted Cash Flow (DCF) Analysis
A Discounted Cash Flow model takes a series of projected future cash flows, then discounts them back to today to estimate what the business might be worth now.
For Crocs, the model is a 2 Stage Free Cash Flow to Equity approach, using free cash flow available to shareholders. The latest twelve month free cash flow is about $697.4 million. Analysts provide explicit forecasts for several years, and Simply Wall St then extrapolates further out to complete a 10 year path. By 2035, the projected free cash flow is $678.0 million, with each year's figure discounted back to today using the model's required return assumptions.
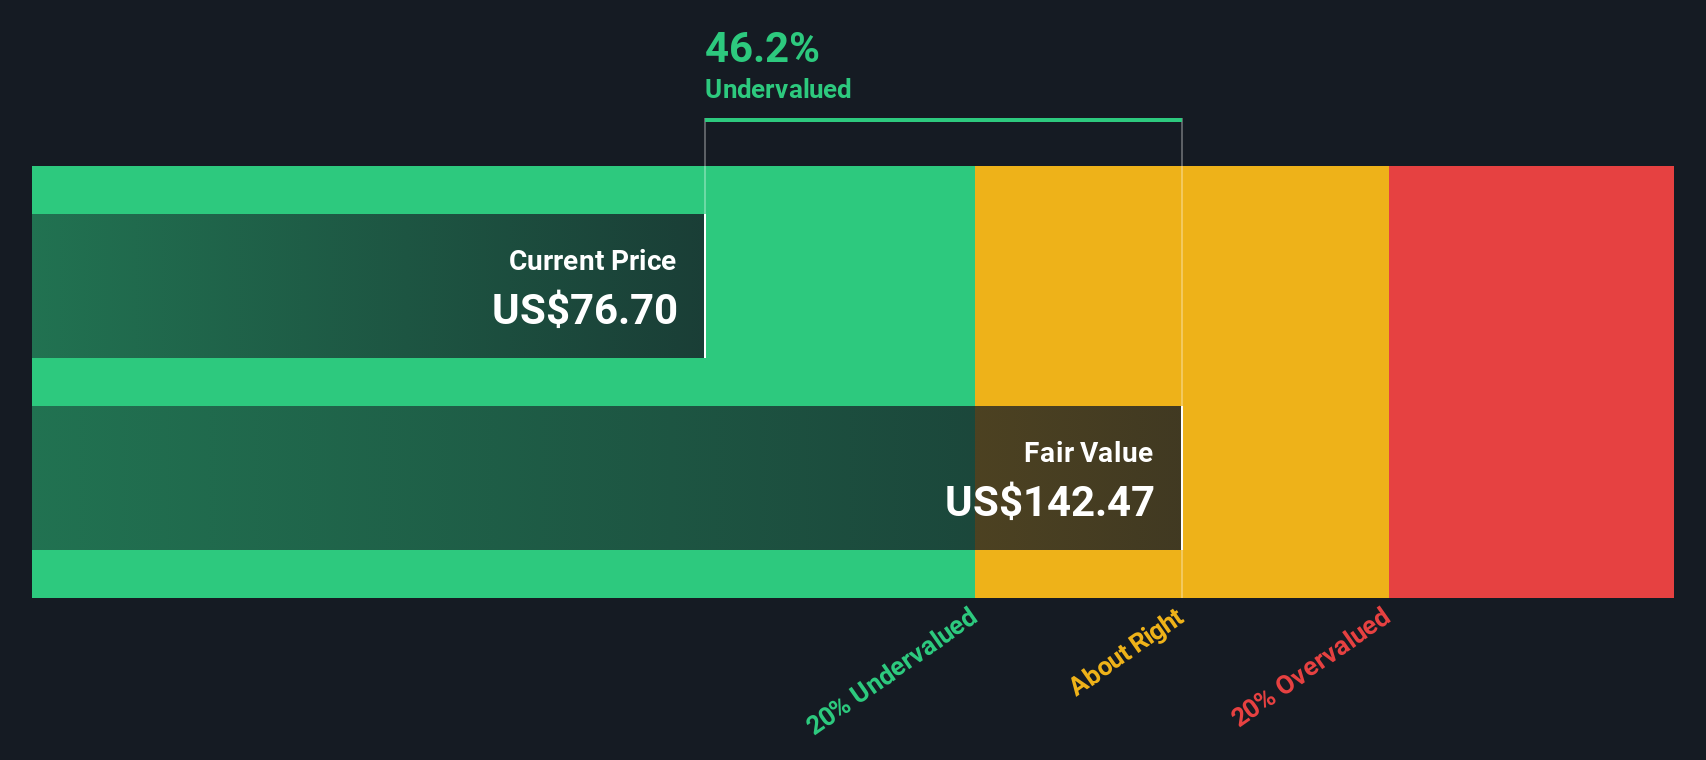
Putting all those discounted cash flows together, plus a terminal value, produces an estimated intrinsic value of about $154.11 per share. Compared with the recent share price of $84.49, this implies a 45.2% discount, which indicates the stock is significantly undervalued on this DCF view.
Result: UNDERVALUED
Our Discounted Cash Flow (DCF) analysis suggests Crocs is undervalued by 45.2%. Track this in your watchlist or portfolio, or discover 55 more high quality undervalued stocks.
Approach 2: Crocs Price vs Earnings
For a profitable business like Crocs, the P/E ratio is a useful way to gauge how much investors are paying for each dollar of current earnings. A higher or lower P/E often reflects what the market expects for future growth and how risky those earnings are perceived to be, so there is no single “correct” level in isolation.
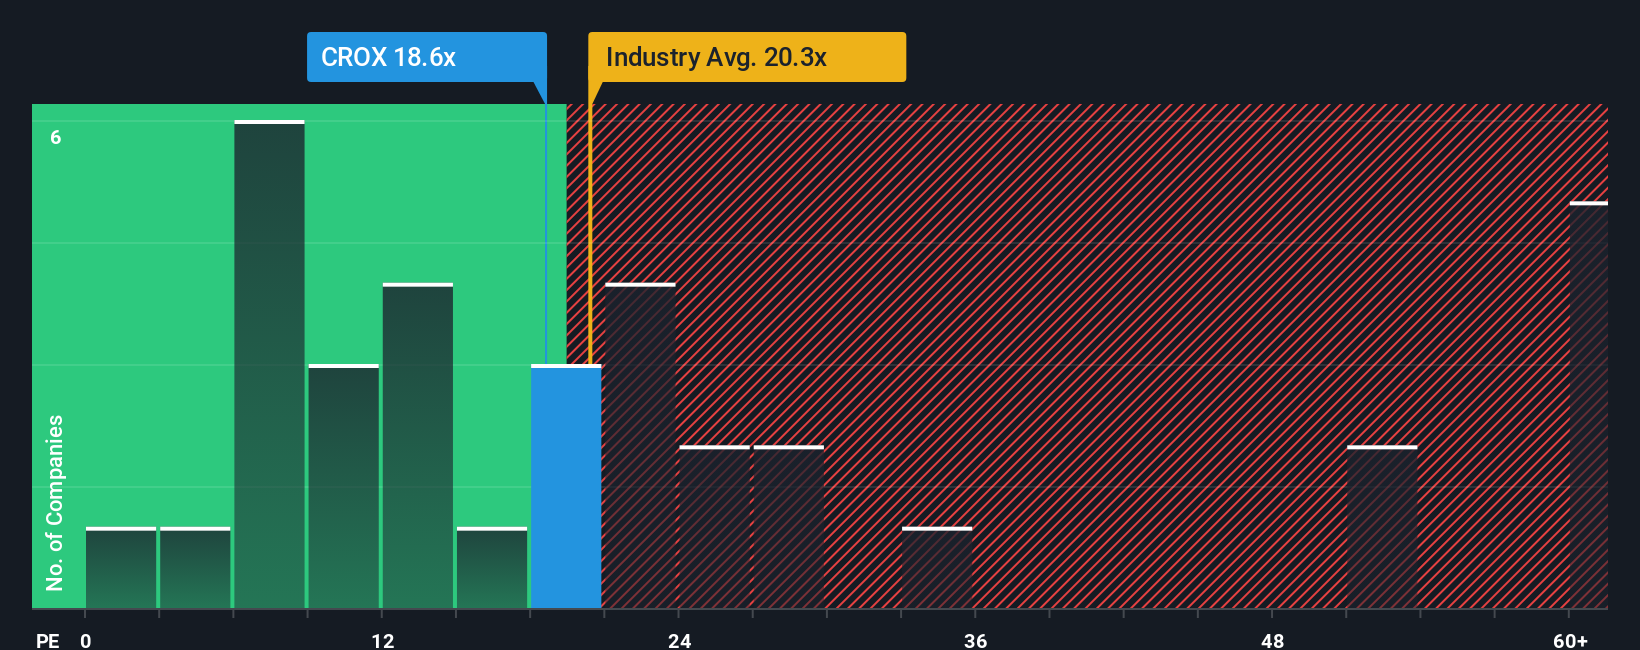
Crocs currently trades on a P/E of 24.0x. That sits above both the Luxury industry average of about 20.7x and the peer group average of 21.5x, so on simple comparisons the shares are priced at a premium to many similar companies.
Simply Wall St’s Fair Ratio is designed to go further than those basic comparisons. It estimates what a more tailored P/E might look like by factoring in elements such as Crocs’ earnings growth profile, profit margins, risk characteristics, industry, and market capitalization. For Crocs, the Fair Ratio is 65.8x, which is well above the current 24.0x. On this framework, the market price sits well below the Fair Ratio, which points to the shares looking undervalued using the preferred multiple.
Result: UNDERVALUED
P/E ratios tell one story, but what if the real opportunity lies elsewhere? Start investing in legacies, not executives. Discover our 22 top founder-led companies.
Upgrade Your Decision Making: Choose your Crocs Narrative
Earlier we mentioned that there is an even better way to think about valuation, so let us introduce you to Narratives, which simply means you attach a clear story about Crocs to your assumptions for future revenue, earnings, margins and, ultimately, what you think the shares are worth. On Simply Wall St, Narratives sit in the Community page and let you link three things in one place: the company story you believe, the financial forecast that flows from that story, and the fair value estimate that falls out of those numbers. You can then compare that Fair Value to today’s US$84.49 share price to help decide whether Crocs looks attractive, fully priced, or less appealing based on your own view, not just a single model. Narratives update automatically when new information such as earnings or news is added, so your story and valuation do not stay frozen. For Crocs, one investor might build a Narrative that points to a fair value well above US$154.11, while another might lean toward a value well below that level, which shows how the same stock can fit very different decision rules.
Do you think there's more to the story for Crocs? Head over to our Community to see what others are saying!
This article by Simply Wall St is general in nature. We provide commentary based on historical data and analyst forecasts only using an unbiased methodology and our articles are not intended to be financial advice. It does not constitute a recommendation to buy or sell any stock, and does not take account of your objectives, or your financial situation. We aim to bring you long-term focused analysis driven by fundamental data. Note that our analysis may not factor in the latest price-sensitive company announcements or qualitative material. Simply Wall St has no position in any stocks mentioned.