Is Cushman & Wakefield (CWK) Pricing Reflecting Recent Share Slump And Cash Flow Outlook?
CUSHMAN & WAKEFIELD PLC CWK | 14.00 | +0.79% |
- If you are wondering whether Cushman & Wakefield shares are cheap, expensive, or somewhere in between right now, this article is for you.
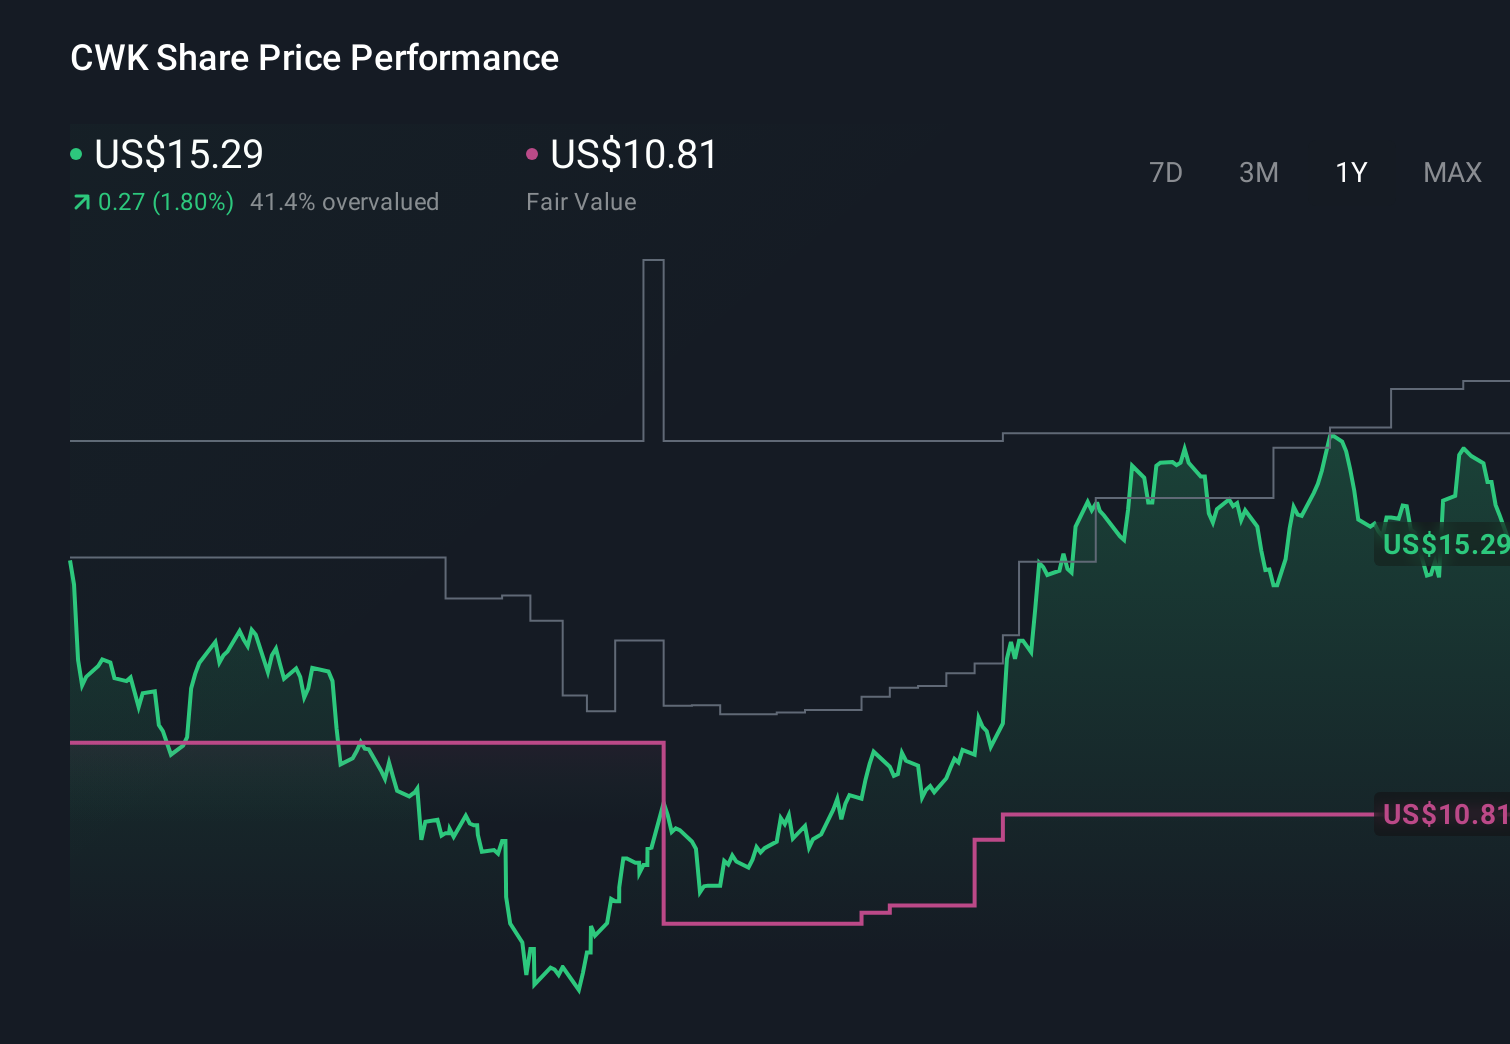
- The stock recently closed at US$12.89, with returns of a 20.2% decline over 7 days, a 21.2% decline over 30 days, an 18.6% decline year to date and a 2.6% decline over the past year, which may have some investors rethinking the balance between risk and potential reward.
- Recent news coverage around Cushman & Wakefield has focused on its position in global commercial real estate services and how that links to broader property market conditions. This context helps frame why the share price has been under pressure and why investors are paying closer attention to what the business might be worth.
- Our valuation model currently gives Cushman & Wakefield a valuation score of 6/6, with each point reflecting one of six checks where the shares screen as undervalued. Next, we will walk through the standard valuation approaches and then finish with a more complete way to think about what the stock could be worth.
Approach 1: Cushman & Wakefield Discounted Cash Flow (DCF) Analysis
A Discounted Cash Flow model estimates what a business could be worth today by projecting its future cash flows and then discounting those back to a present value.
For Cushman & Wakefield, the model starts with last twelve months free cash flow of about $155.9 million. Analysts provide free cash flow estimates out to 2029, and Simply Wall St then extrapolates further. Within the ten year projection, free cash flow is forecast to reach $579.4 million in 2035, with interim estimates such as $244.5 million in 2026 and $398 million in 2029, all in $ and all treated on a 2 Stage Free Cash Flow to Equity basis.
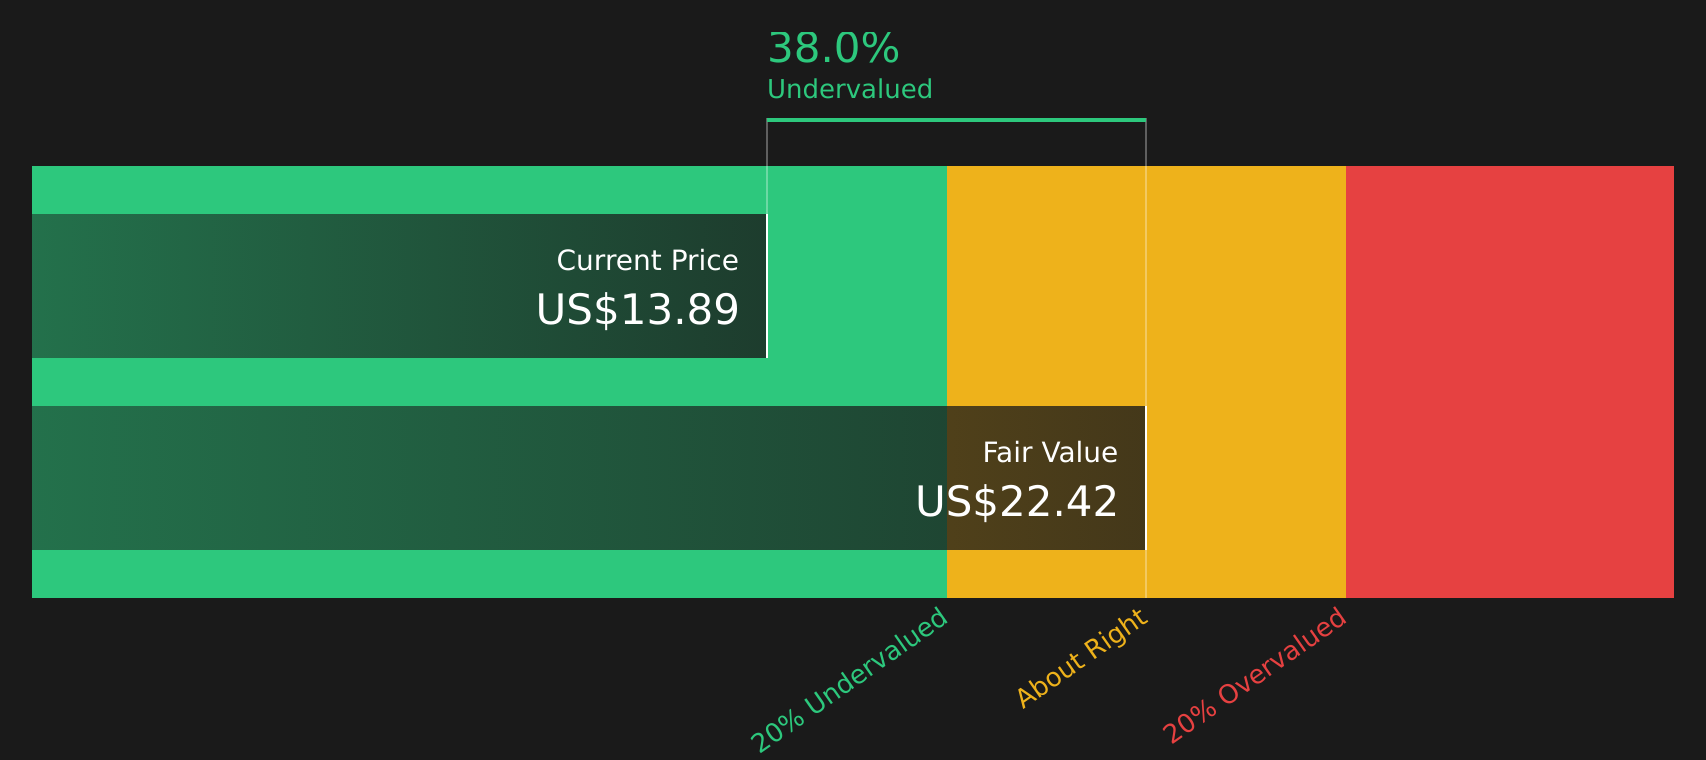
After discounting those projected cash flows back to today, the model arrives at an estimated intrinsic value of about $21.00 per share. Compared with the recent share price of $12.89, this implies a 38.6% discount, which indicates that the shares screen as materially undervalued on this DCF view.
Result: UNDERVALUED
Our Discounted Cash Flow (DCF) analysis suggests Cushman & Wakefield is undervalued by 38.6%. Track this in your watchlist or portfolio, or discover 53 more high quality undervalued stocks.
Approach 2: Cushman & Wakefield Price vs Earnings
For profitable companies, the P/E ratio is a useful shorthand because it links what you pay for each share directly to the earnings that business is currently generating. It lets you quickly compare how the market is pricing those earnings across different companies.
What counts as a “normal” P/E often reflects how the market views a company’s growth prospects and risk. Higher expected growth and lower perceived risk can justify a higher P/E, while lower growth expectations or higher risk can point to a lower P/E being more reasonable.
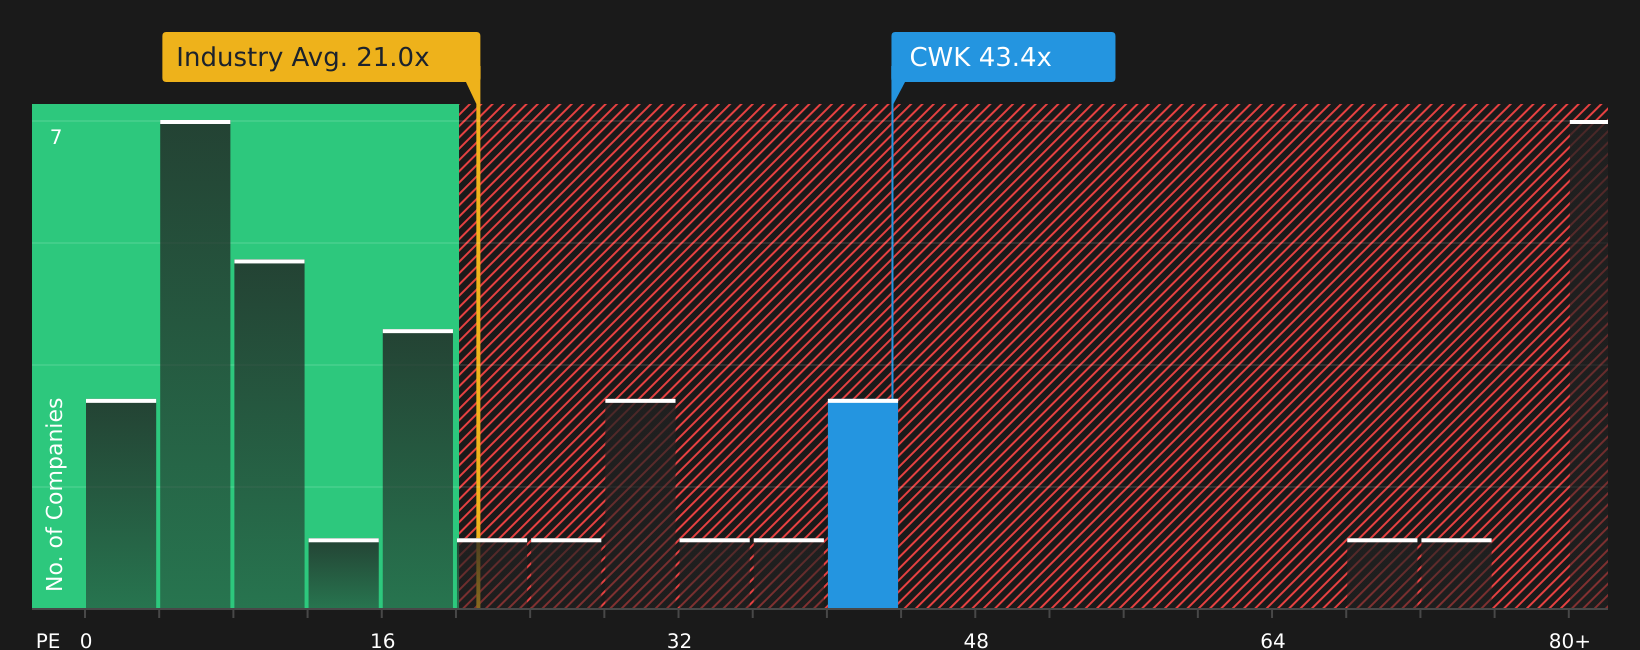
Cushman & Wakefield is trading on a P/E of 13.36x. That sits below both the Real Estate industry average of 27.49x and the peer average of 24.74x. Simply Wall St’s Fair Ratio for Cushman & Wakefield is 18.96x, which is the P/E level its model suggests could be appropriate given factors such as earnings growth, profit margins, industry, market cap and specific risks.
The Fair Ratio is more tailored than a simple peer or industry comparison because it adjusts for the company’s own characteristics rather than assuming all businesses in the group deserve similar multiples. With the current P/E of 13.36x sitting below the Fair Ratio of 18.96x, the shares screen as undervalued on this earnings based approach.
Result: UNDERVALUED
P/E ratios tell one story, but what if the real opportunity lies elsewhere? Start investing in legacies, not executives. Discover our 23 top founder-led companies.
Upgrade Your Decision Making: Choose your Cushman & Wakefield Narrative
Earlier we mentioned that there is an even better way to understand valuation. Narratives let you attach a clear story about Cushman & Wakefield to the numbers you care about, linking your view on its future revenue, earnings and margins to a fair value estimate that you can compare directly with today’s share price.
On Simply Wall St’s Community page, Narratives are an easy to use tool that helps you spell out why you think the company should be worth a certain amount, connect that view to a forecast, and then see in one place whether your fair value suggests the stock belongs on your watchlist or if you would prefer to wait.
Because Narratives refresh when new information such as earnings, company updates or news is added to the platform, your story and fair value do not stay static but keep reflecting the latest data without you needing to rebuild your analysis each time.
For example, one Cushman & Wakefield Narrative on the optimistic end might set fair value around US$21.69 based on higher assumed growth and margins. A more cautious Narrative might sit closer to US$12 using lower growth and profitability assumptions, and seeing those side by side can help you decide which story feels closer to your own view.
Do you think there's more to the story for Cushman & Wakefield? Head over to our Community to see what others are saying!
This article by Simply Wall St is general in nature. We provide commentary based on historical data and analyst forecasts only using an unbiased methodology and our articles are not intended to be financial advice. It does not constitute a recommendation to buy or sell any stock, and does not take account of your objectives, or your financial situation. We aim to bring you long-term focused analysis driven by fundamental data. Note that our analysis may not factor in the latest price-sensitive company announcements or qualitative material. Simply Wall St has no position in any stocks mentioned.